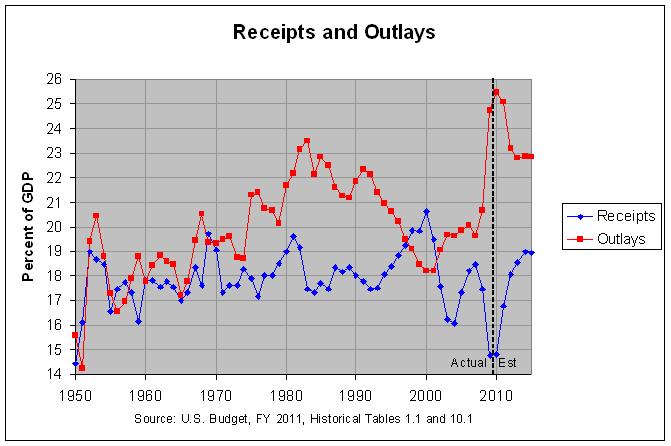
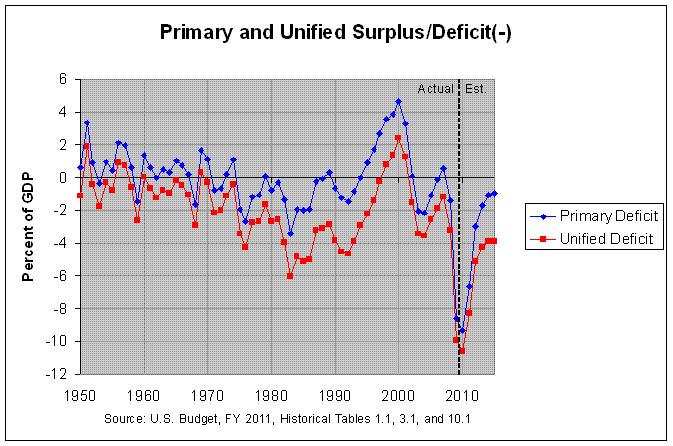
            UNIFIED AND PRIMARY SURPLUS/DEFICIT(-) AND AVERAGE OUTLAYS
                                 (percent of GDP)
                                                                             Average
                                        Non-   Unified   Primary             Outlays
                               Net  Interest  Surplus/  Surplus/       GDP   through
Year  Receipts   Outlays  Interest   Outlays   Deficit   Deficit    ($bil)      2009
----  --------  --------  --------  --------  --------  --------  --------  --------
1940       6.8       9.8       0.9       8.9      -3.0      -2.1      96.8     20.45
1941       7.6      12.0       0.8      11.1      -4.3      -3.5     114.1     20.60
1942      10.1      24.3       0.7      23.6     -14.2     -13.5     144.3     20.73
1943      13.3      43.6       0.8      42.7     -30.3     -29.4     180.3     20.68
1944      20.9      43.6       1.1      42.6     -22.7     -21.7     209.2     20.33
1945      20.4      41.9       1.4      40.5     -21.5     -20.1     221.4     19.97
1946      17.7      24.8       1.8      23.0      -7.2      -5.3     222.6     19.63
1947      16.5      14.8       1.8      13.0       1.7       3.5     233.2     19.55
1948      16.2      11.6       1.7       9.9       4.6       6.3     256.6     19.62
1949      14.5      14.3       1.7      12.6       0.2       1.9     271.3     19.76
1950      14.4      15.6       1.8      13.8      -1.1       0.6     273.1     19.85
1951      16.1      14.2       1.5      12.8       1.9       3.4     320.2     19.92
1952      19.0      19.4       1.3      18.1      -0.4       0.9     348.7     20.02
1953      18.7      20.4       1.4      19.0      -1.7      -0.4     372.5     20.03
1954      18.5      18.8       1.3      17.5      -0.3       1.0     377.0     20.02
1955      16.5      17.3       1.2      16.1      -0.8       0.5     395.9     20.04
1956      17.5      16.5       1.2      15.4       0.9       2.1     427.0     20.09
1957      17.7      17.0       1.2      15.8       0.8       1.9     450.9     20.16
1958      17.3      17.9       1.2      16.7      -0.6       0.6     460.0     20.22
1959      16.2      18.8       1.2      17.6      -2.6      -1.4     490.2     20.27
1960      17.8      17.8       1.3      16.4       0.1       1.4     518.9     20.30
1961      17.8      18.4       1.3      17.2      -0.6       0.6     529.9     20.35
1962      17.6      18.8       1.2      17.6      -1.3       0.0     567.8     20.39
1963      17.8      18.6       1.3      17.3      -0.8       0.5     599.2     20.42
1964      17.6      18.5       1.3      17.2      -0.9       0.4     641.5     20.46
1965      17.0      17.2       1.2      15.9      -0.2       1.0     687.5     20.51
1966      17.3      17.8       1.2      16.6      -0.5       0.8     755.8     20.58
1967      18.4      19.4       1.3      18.2      -1.1       0.2     810.0     20.65
1968      17.6      20.5       1.3      19.2      -2.9      -1.6     868.4     20.67
1969      19.7      19.4       1.3      18.0       0.3       1.7     948.1     20.68
1970      19.0      19.3       1.4      17.9      -0.3       1.1    1012.7     20.71
1971      17.3      19.5       1.4      18.1      -2.1      -0.8    1080.0     20.75
1972      17.6      19.6       1.3      18.3      -2.0      -0.7    1176.5     20.78
1973      17.6      18.7       1.3      17.4      -1.1       0.2    1310.6     20.81
1974      18.3      18.7       1.5      17.2      -0.4       1.1    1438.5     20.87
1975      17.9      21.3       1.5      19.8      -3.4      -1.9    1560.2     20.93
1976      17.1      21.4       1.5      19.9      -4.2      -2.7    1738.1     20.92
1977      18.0      20.7       1.5      19.2      -2.7      -1.2    1973.5     20.91
1978      18.0      20.7       1.6      19.1      -2.7      -1.1    2217.5     20.91
1979      18.5      20.1       1.7      18.4      -1.6       0.1    2501.4     20.92
1980      19.0      21.7       1.9      19.8      -2.7      -0.8    2724.2     20.94
1981      19.6      22.2       2.2      19.9      -2.6      -0.3    3057.0     20.92
1982      19.2      23.1       2.6      20.5      -4.0      -1.3    3223.7     20.87
1983      17.5      23.5       2.6      20.9      -6.0      -3.4    3440.7     20.79
1984      17.3      22.2       2.9      19.3      -4.8      -1.9    3844.4     20.68
1985      17.7      22.8       3.1      19.7      -5.1      -2.0    4146.3     20.63
1986      17.5      22.5       3.1      19.4      -5.0      -1.9    4403.9     20.53
1987      18.4      21.6       3.0      18.6      -3.2      -0.2    4651.4     20.45
1988      18.2      21.3       3.0      18.2      -3.1      -0.1    5008.5     20.40
1989      18.4      21.2       3.1      18.1      -2.8       0.3    5399.5     20.36
1990      18.0      21.9       3.2      18.6      -3.9      -0.6    5734.5     20.32
1991      17.8      22.3       3.3      19.1      -4.5      -1.3    5930.5     20.24
1992      17.5      22.1       3.2      18.9      -4.7      -1.5    6242.0     20.12
1993      17.5      21.4       3.0      18.4      -3.9      -0.9    6587.3     20.00
1994      18.0      21.0       2.9      18.0      -2.9       0.0    6976.6     19.91
1995      18.4      20.6       3.2      17.5      -2.2       0.9    7341.1     19.84
1996      18.8      20.2       3.1      17.1      -1.4       1.7    7718.3     19.79
1997      19.2      19.5       3.0      16.5      -0.3       2.7    8211.7     19.75
1998      19.9      19.1       2.8      16.3       0.8       3.6    8663.0     19.77
1999      19.8      18.5       2.5      16.0       1.4       3.9    9208.4     19.84
2000      20.6      18.2       2.3      15.9       2.4       4.7    9821.0     19.97
2001      19.5      18.2       2.0      16.2       1.3       3.3   10225.3     20.17
2002      17.6      19.1       1.6      17.5      -1.5       0.1   10543.9     20.41
2003      16.2      19.7       1.4      18.3      -3.4      -2.0   10979.8     20.60
2004      16.1      19.6       1.4      18.2      -3.5      -2.2   11685.6     20.76
2005      17.3      19.9       1.5      18.4      -2.6      -1.1   12445.7     20.99
2006      18.2      20.1       1.7      18.4      -1.9      -0.2   13224.9     21.27
2007      18.5      19.6       1.7      17.9      -1.2       0.5   13896.0     21.67
2008      17.5      20.7       1.8      18.9      -3.2      -1.4   14439.0     22.68
2009      14.8      24.7       1.3      23.4      -9.9      -8.6   14237.2     24.71

2010*     14.8      25.4       1.3      24.2     -10.6      -9.4   14623.9
2011*     16.8      25.1       1.6      23.4      -8.3      -6.6   15299.0
2012*     18.1      23.2       2.1      21.1      -5.1      -3.0   16203.3
2013*     18.6      22.8       2.5      20.3      -4.2      -1.7   17182.2
2014*     19.0      22.9       2.8      20.1      -3.9      -1.1   18192.6
2015*     18.9      22.9       3.0      19.9      -3.9      -0.9   19190.4

* estimated
Note: Net Interest equals the Gross Interest on Treasury Debt Securities
      minus the interest received by the trust funds and minus two items
      labelled "Other interest" and "Other investment income";
      Unified Surplus/Deficit equals Receipts minus Outlays;
      Primary Surplus/Deficit equals Receipts minus Non-interest Outlays;
      Non-interest Outlays equal Outlays minus Net Interest
Source: Budget of the United States Government, FY 2011, Historical Tables,
        tables 1.1, 3.1, and 10.1
Go to Budget Home Page