Media Coverage of Southwest Land Border Encounters
Analyzing Data on Southwest Land Border Encounters on the CBP Website
Analyzing Data on Southwest Land Border Encounters by Property
Comparing Southwest Land Border Encounters and Job Openings
Filtering Data on Southwest Land Border Encounters by Property
Media Coverage of Southwest Land Border Encounters
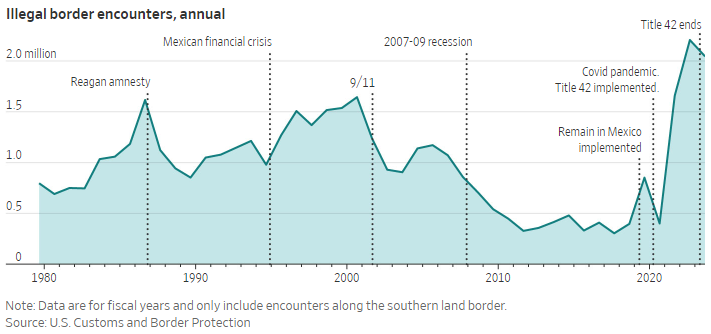
As widely reported, there has been a recent increase in illegal encounters at the Southwest border. The introduction to a Wall Street Journal article contains the following chart:
As can be seen in the notes below the chart, the data are for fiscal years and only include encounters along the southern land border and come from U.S. Customs and Border Protection (CBP). An audio introduction to the article below the chart includes the following:
In the past, most migrants were single adults from Mexico looking for work. If caught by the Border Patrol, they could easily and quickly be deported. Now, a fast-growing share are families with children, who are difficult to deport to their home countries. The change started around 2014 and has exploded in the past two years. Many families are fleeing gang violence in Central America, though recently a growing number are escaping political repression and poverty in South America.
An article in "The Hill" goes into more detail, stating:
A global refugee crisis is playing out around the world, with about 110 million people worldwide who were forced from their homes as of the end of 2022 - the most since the chaos during and after World War II, according to the United Nations.
In the Western Hemisphere, that global crisis has its own regional tinge, playing out amid economic collapse and authoritarian rule in countries such as Venezuela and Nicaragua, and a rise in civil violence and targeted killings in Mexican states such as Michoacan and Guerrero, according to CBP.
Further on, it mentions the problem of human smuggling, stating:
For example, "pseudo-legitimate" travel agencies are selling migrants around the world border-flouting travel packages that route them to jurisdictions from which they can more easily enter the U.S.
And new van and bus lines operated out of the Mexican state of Sonora are dropping migrants from as far away as Bangladesh and China in the Arizona desert, where they "overwhelm" local agents.
The fact that migrants are coming from a wider range of nations and the growth in human smuggling are also mentioned in a Washington Post article which states:
The migrants are coming from a wider range of nations than ever before. Men from China, India and Turkey have been crossing into California near the town of Jacumba Hot Springs, huddling around campfires as they wait for U.S. agents to take them into custody. Families from Mexico and Central America and men from Africa are coming through the deserts south of Arizona - demographic patterns that are telltale signs of smuggler-directed operations, CBP officials say.
CBP officials say the current volume of migrants is twice the size of what the agency's budget can support.
Analyzing Data on Southwest Land Border Encounters on the CBP Website
Data on southwest land border encounters can be examined using an interactive chart on the U.S. Customs and Border Protection (CBP) website, shown below:
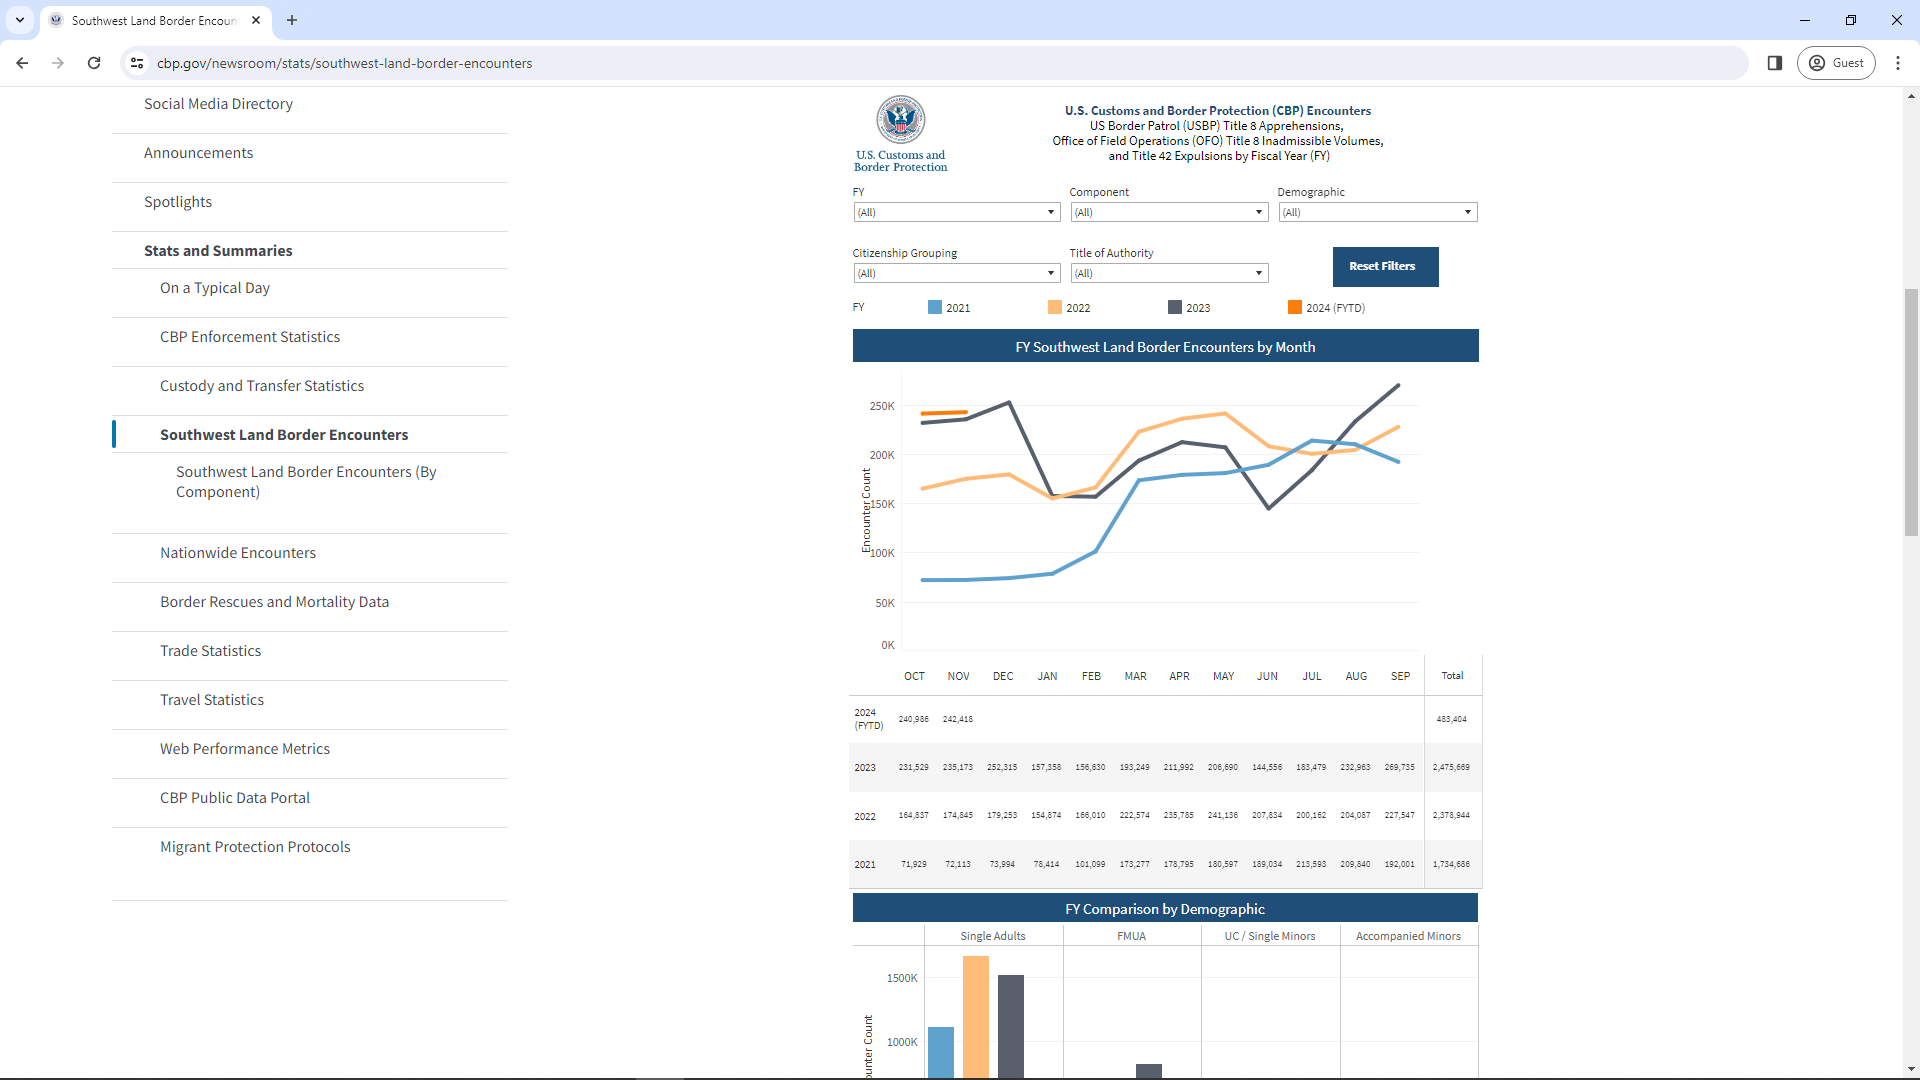
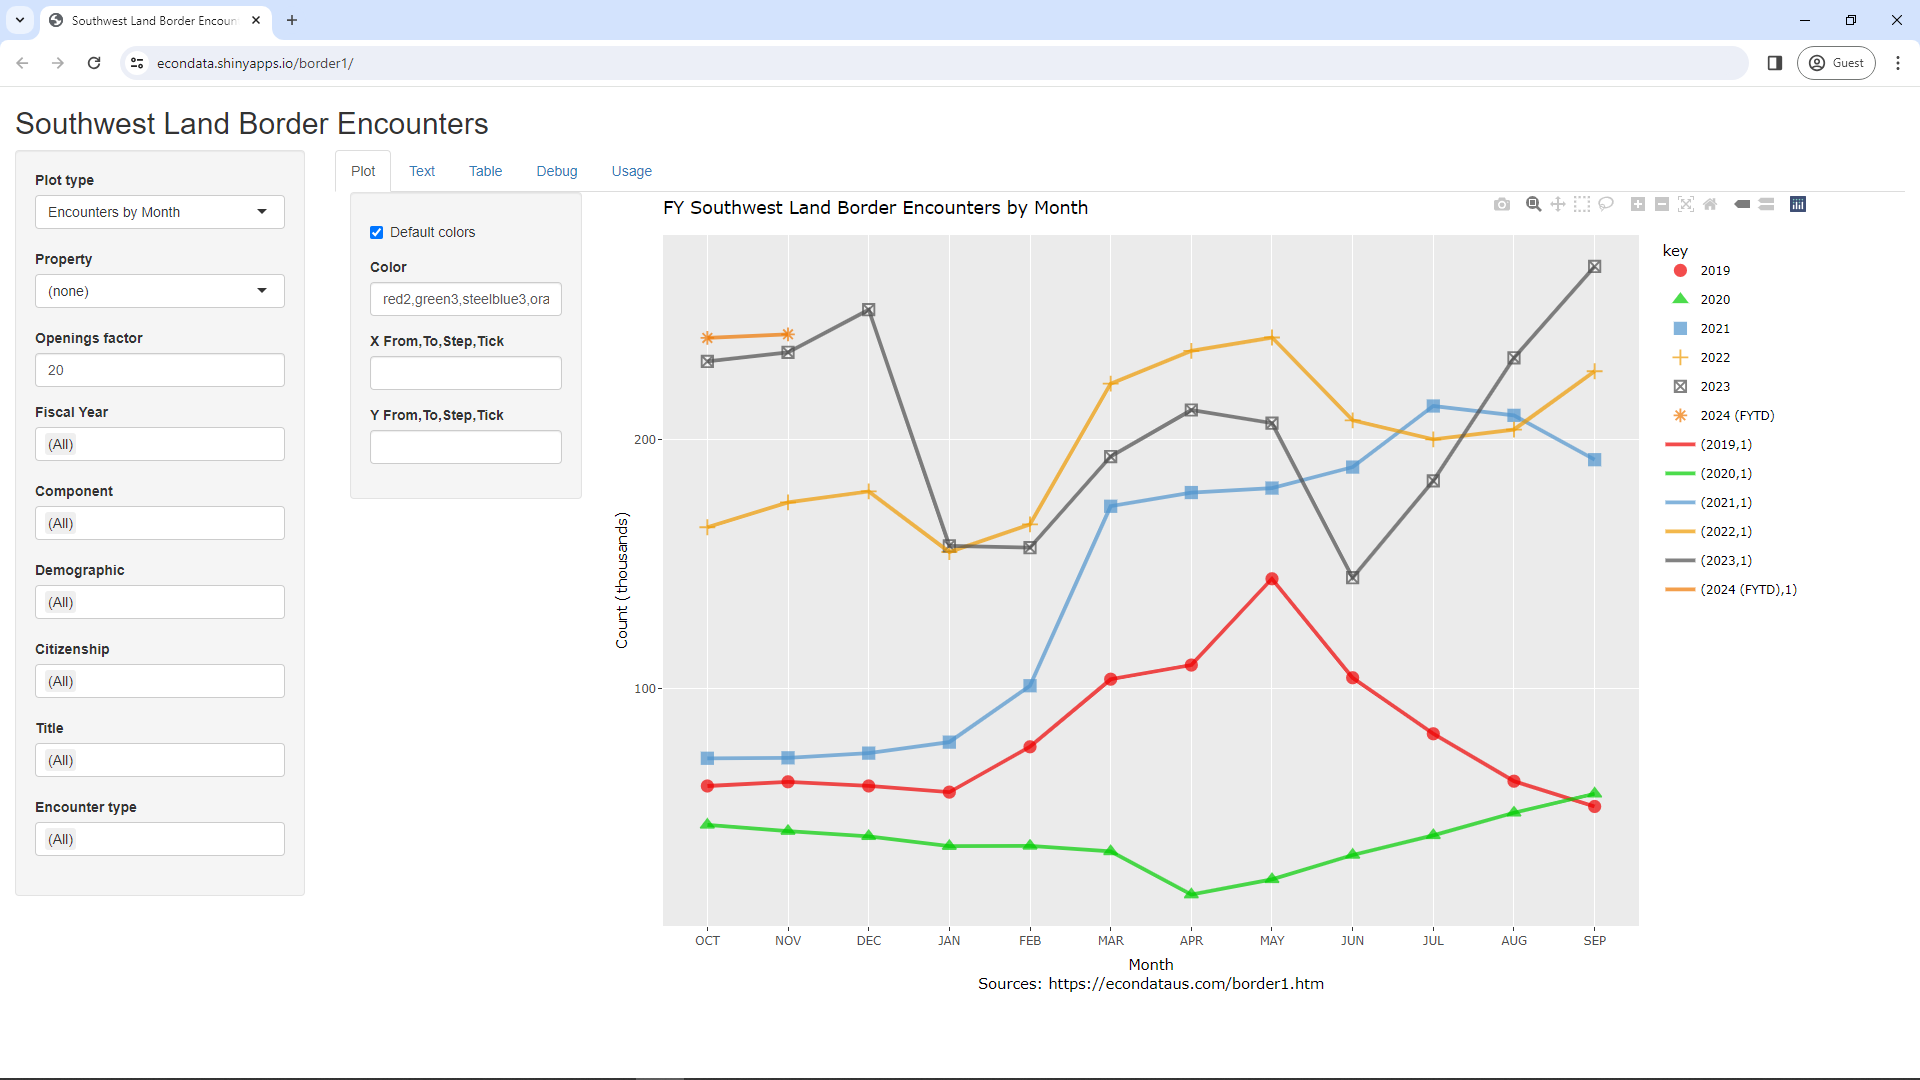
The data in this chart appears to come from the file labeled FY21 - FY24(FYTD) Southwest Land Border Encounters - November on this CBP page. A functionally equivalent chart can also be found in an R Shiny application at https://econdata.shinyapps.io/border1/ except that that chart also includes data from 2019 and 2020. That data comes from the files on the aforementioned page labeled FY19 - FY22 Southwest Land Border Encounters (for 2019 data) and FY20 - FY23 Southwest Land Border Encounters (for 2020 data). That chart is the default chart at https://econdata.shinyapps.io/border1/ and is shown below:
Analyzing Data on Southwest Land Border Encounters by Property
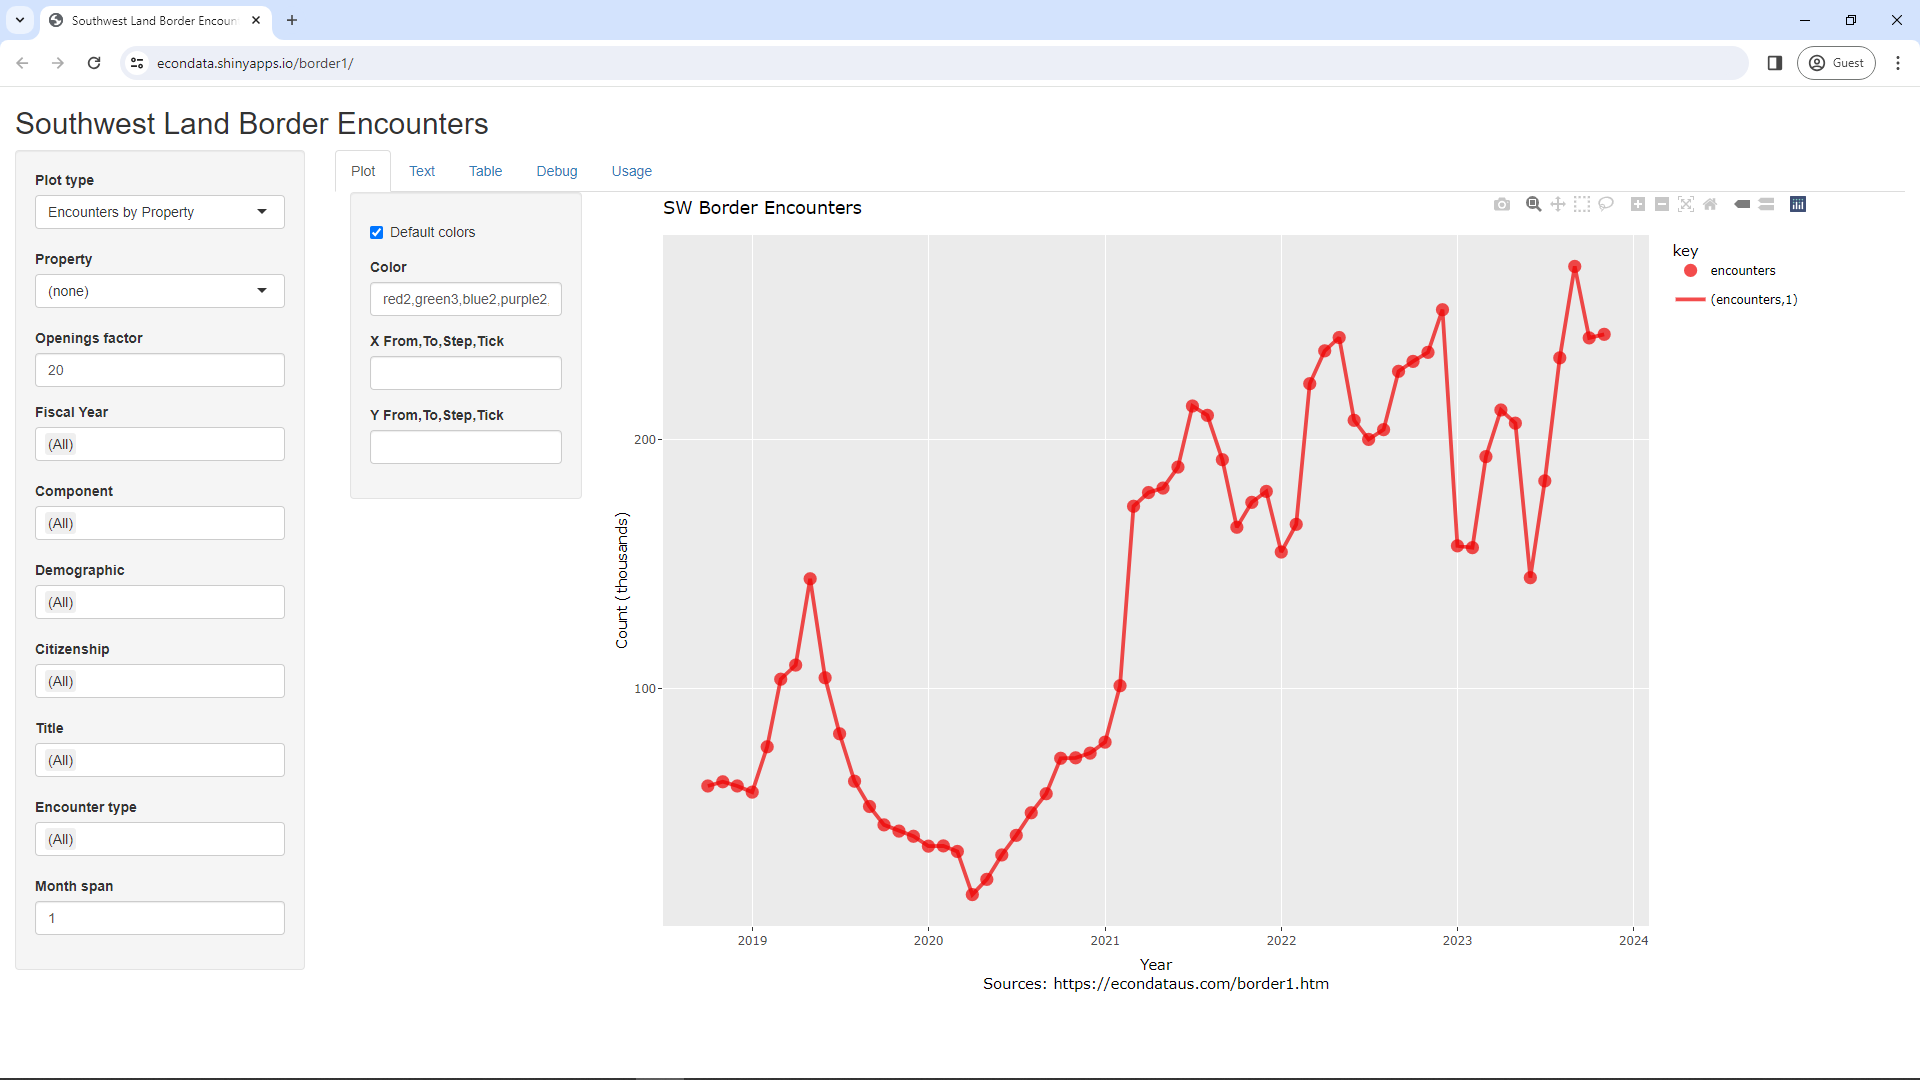
This format of showing encounters by month can be useful in comparing the change in encounters over each year. However, it's sometimes preferable to look at the data over the entire time span. Changing "Plot type" to "Encounters by Property" will display the following:
The above graph shows a single line because the Property select list is set to "(none)". Changing it to "demographic" will display the following:
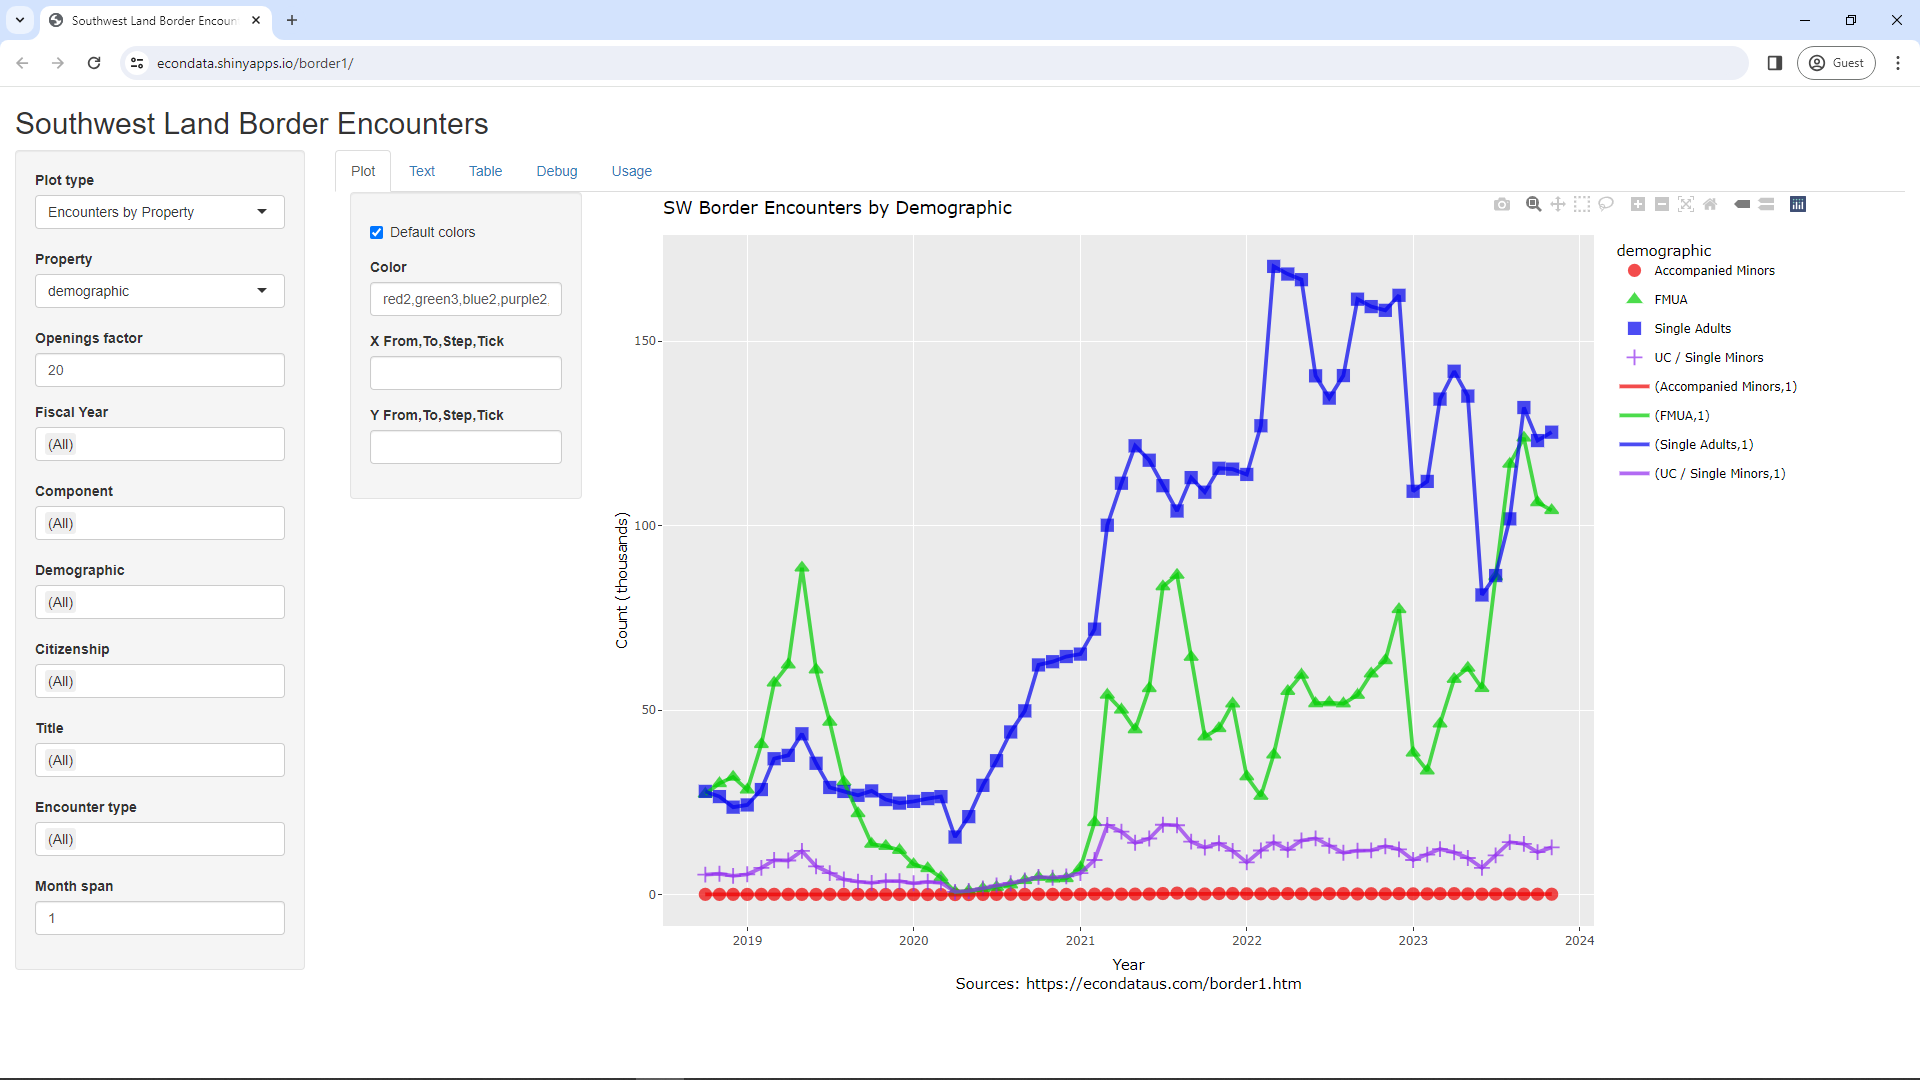
The above graph displays the data by the following 4 demographics, listed at the top of this CBP webpage.
Changing the Property select list to "citizenship" will display the following:
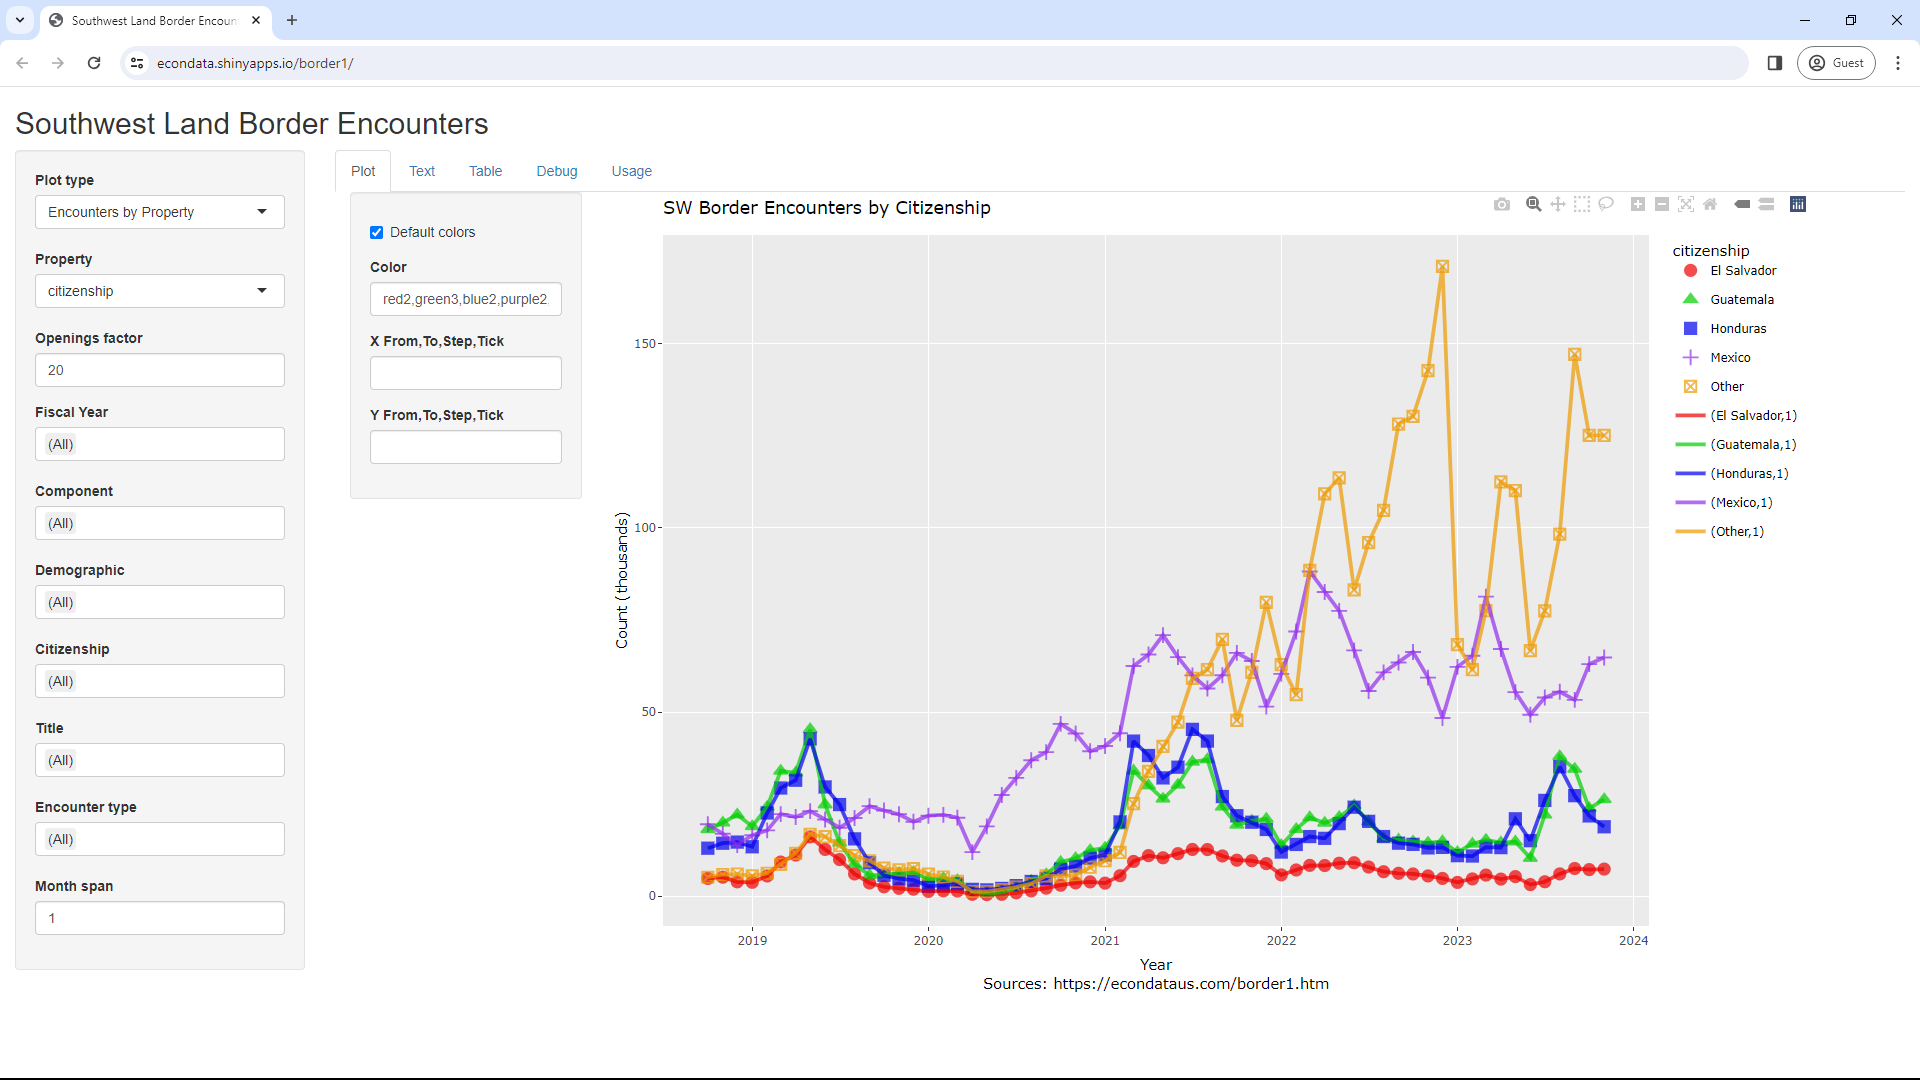
As can be seen, the most common citizenship was Mexico until mid-2021 when it was surpassed by "Other", denoting those countries other than Mexico and the 3 countries in the "Northern Triangle" of countries just south of Mexico (El Salvador, Guatemala, and Honduras). Encounters from the Northern Triangle countries spiked in 2019, 2021, and 2023. Interestingly, the two largest countries, Guatemala, and Honduras, seem to usually be at similar levels.
Changing the Property select list to "ecounter_type" will display the following:
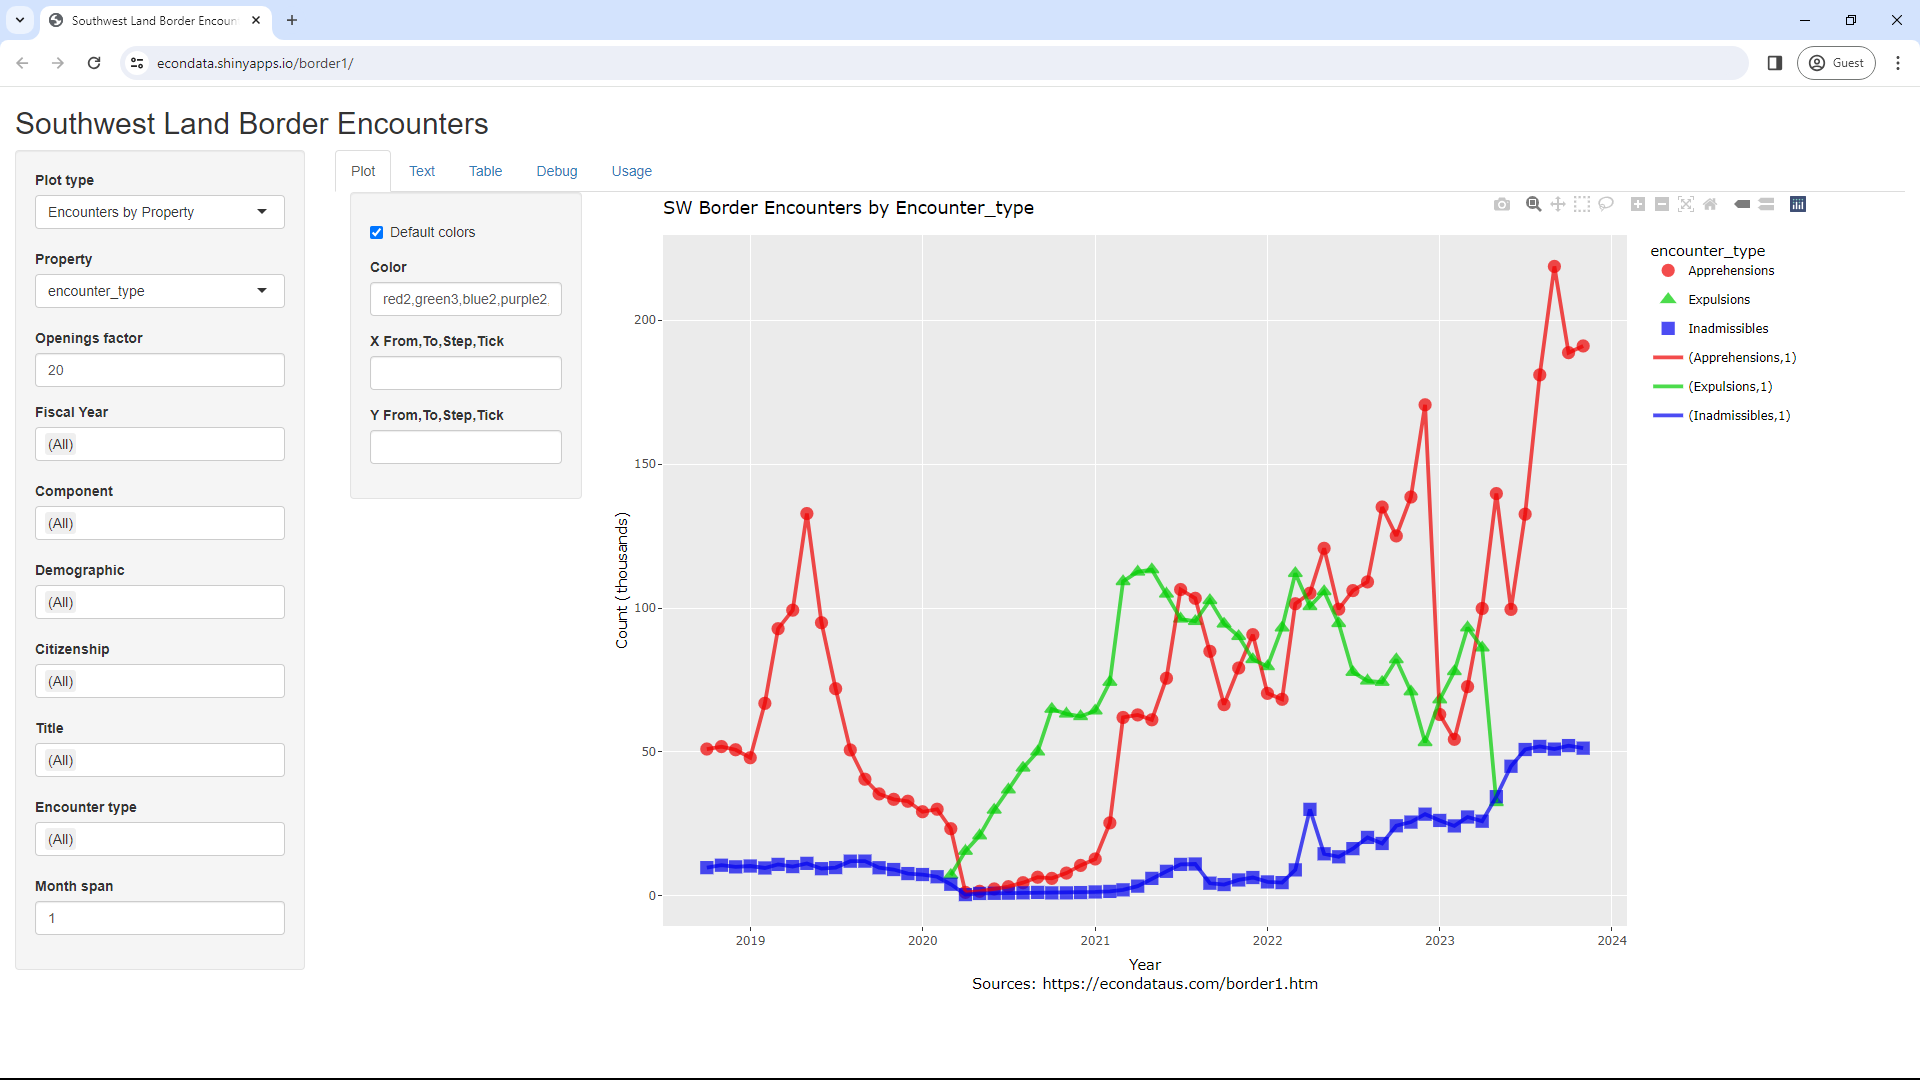
As can be seen, Expulsions only occurred from March of 2020 to May of 2023. That's because Expulsions occur only under Title 42 which was only in effect during that time period. Apprehensions and Inadmissibles both occur under Title 8.
Comparing Southwest Land Border Encounters and Job Openings
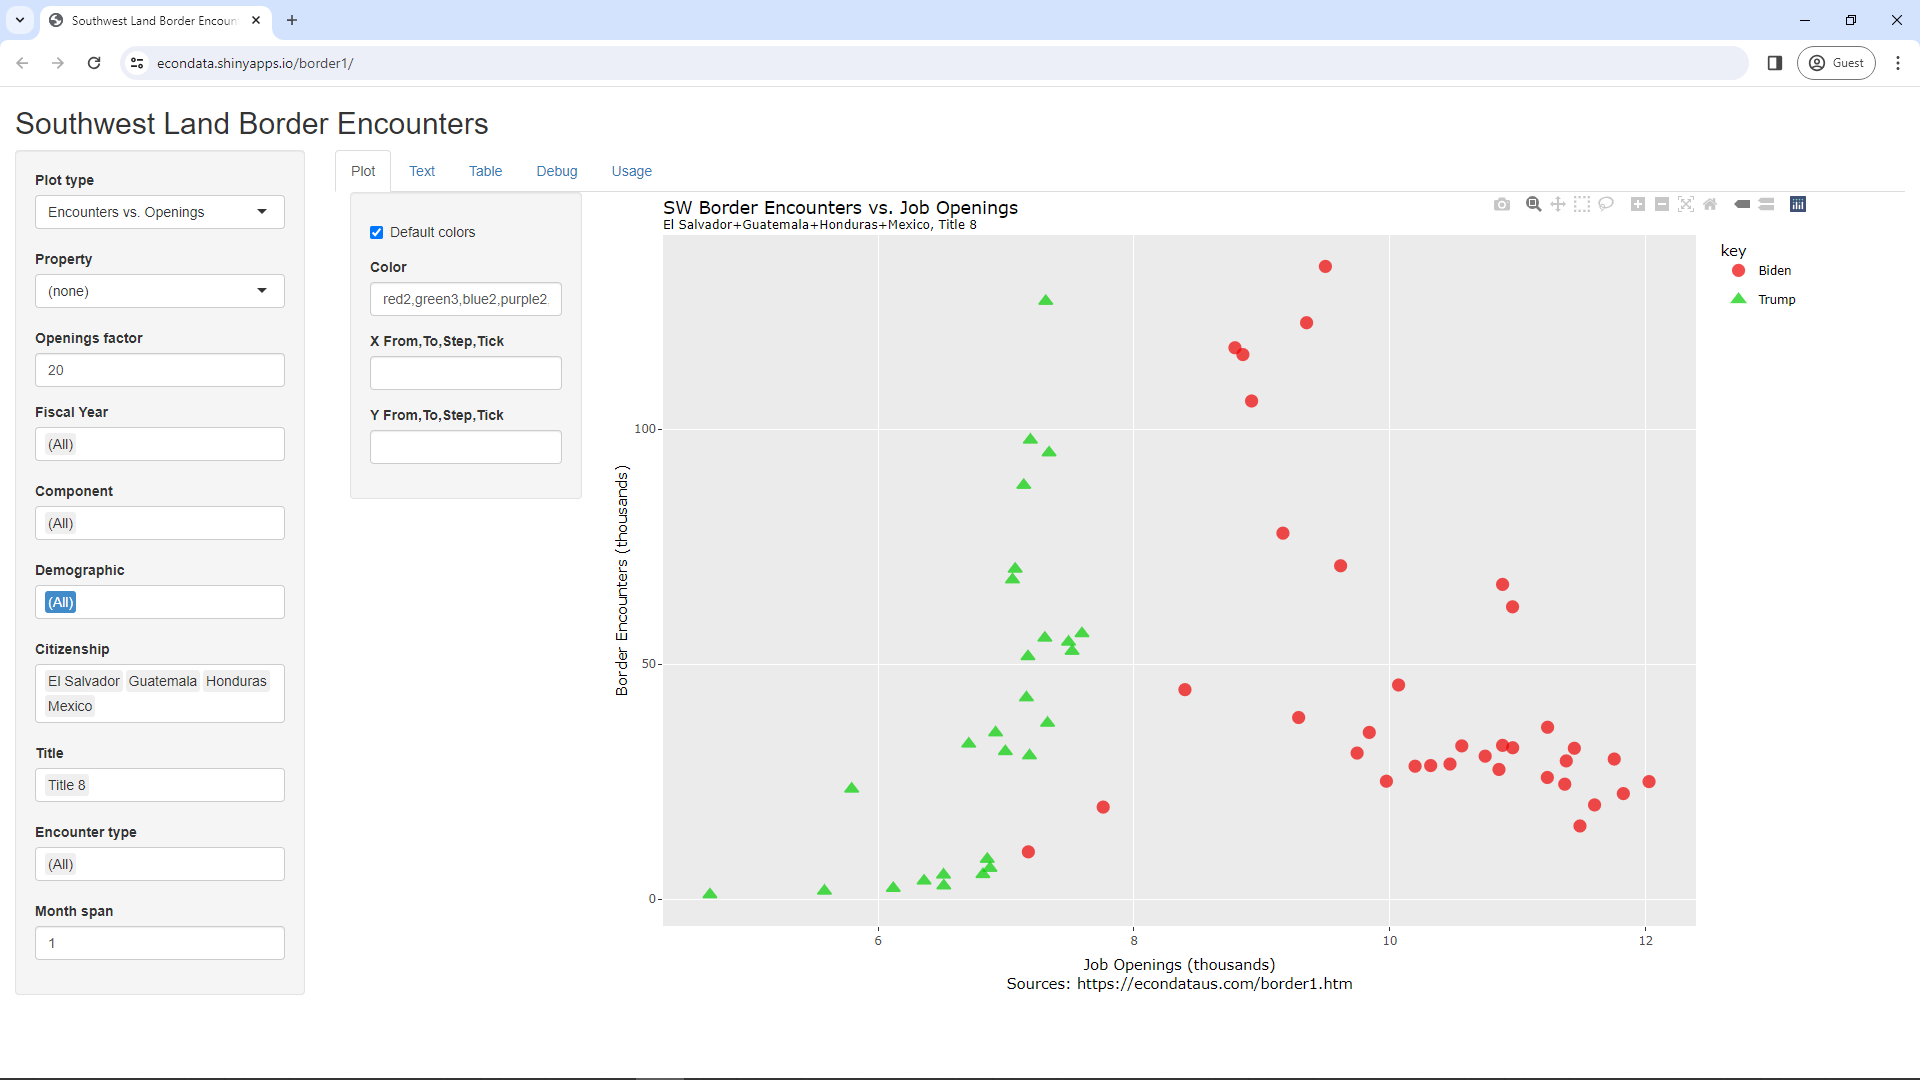
There is a 2023 Cato paper posted online that is titled "The US Labor Market Explains Most of the Increase in Illegal Immigration". Figure 2 in that paper plots Southwest Border Patrol encounters versus Nonfarm job openings to support it's claim that "most of the increase in illegal immigration can be blamed on the strength of the labor market rather than the administration's tinkering with border enforcement policies". Changing "Plot type" in the application to "Encounters vs. Openings" will display the following scatter plot that is nearly identical to Figure 2:
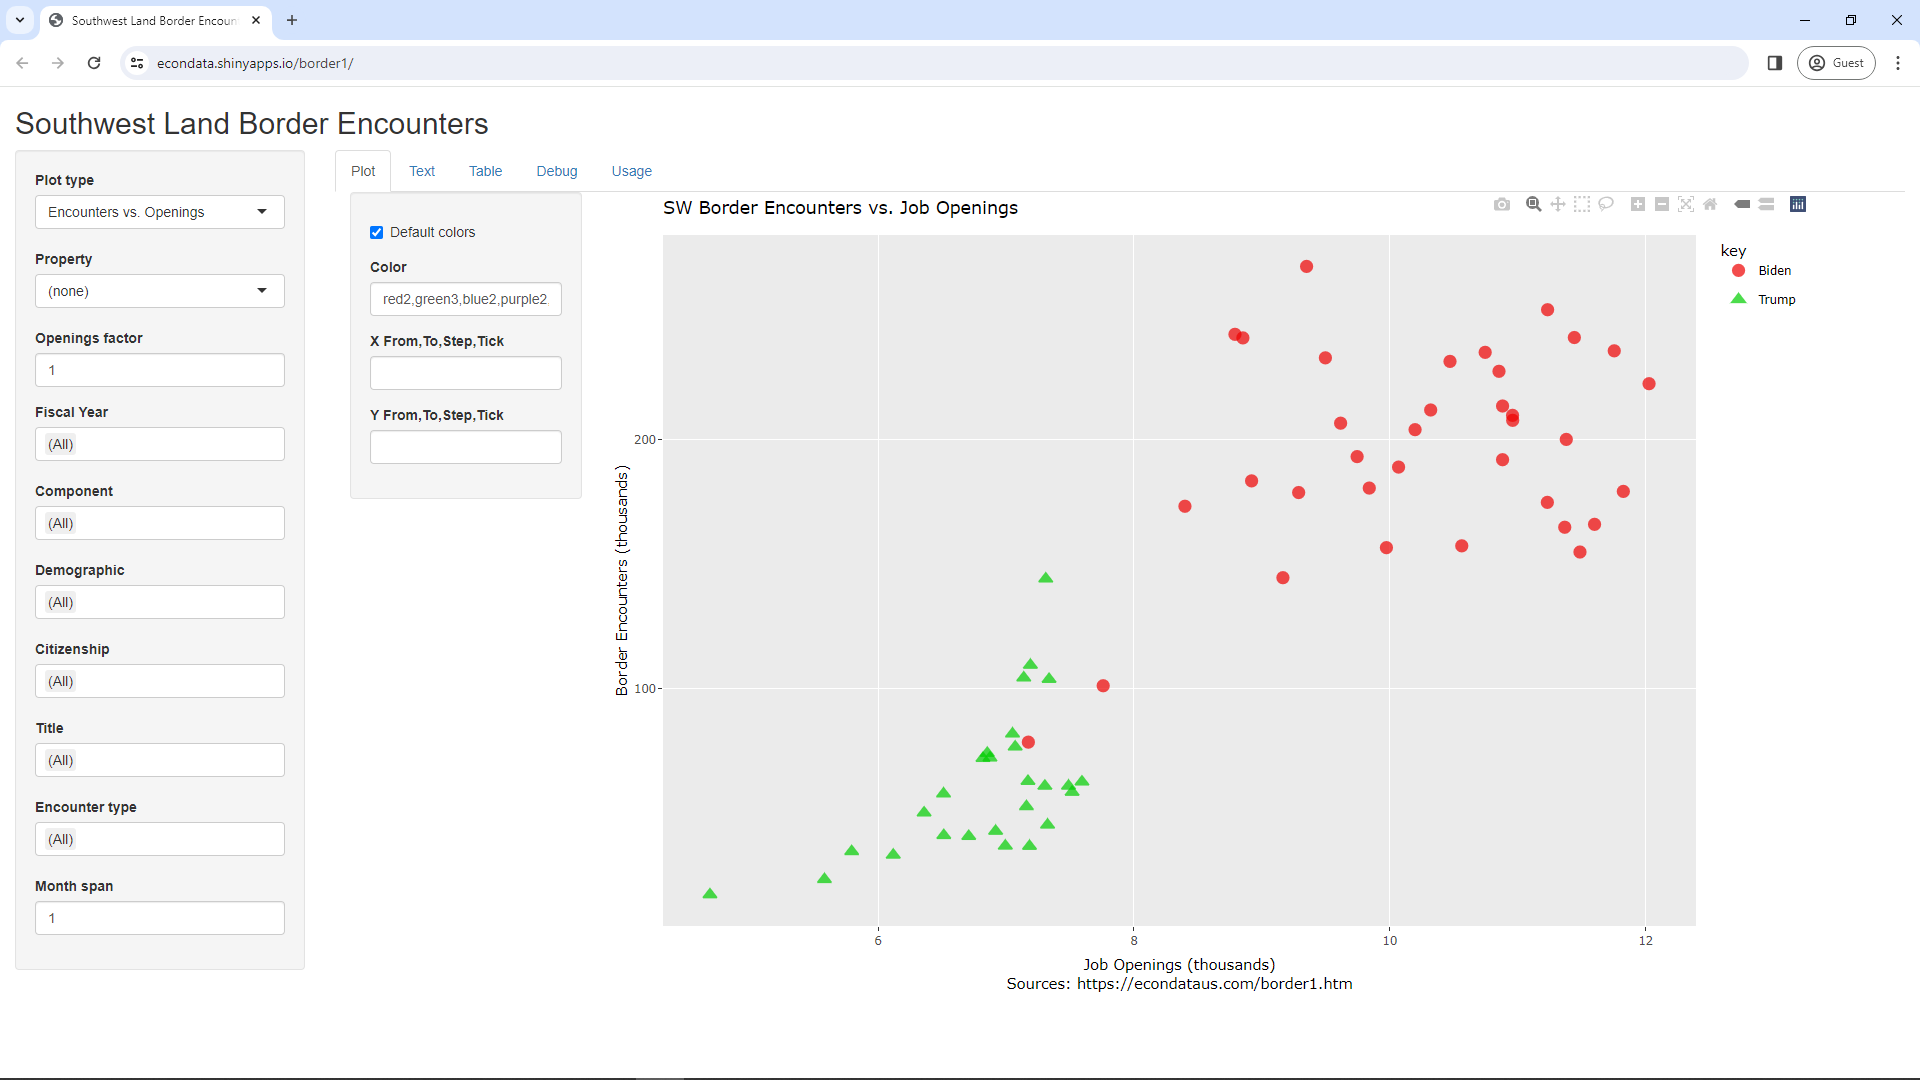
As seen, the above plot does seem to suggest a correlation between border encounters and job openings. However, changing the "Plot type" select list to "Encounters and Openings" will display the following graph of both variables with the x-axis set to the time (month and year):
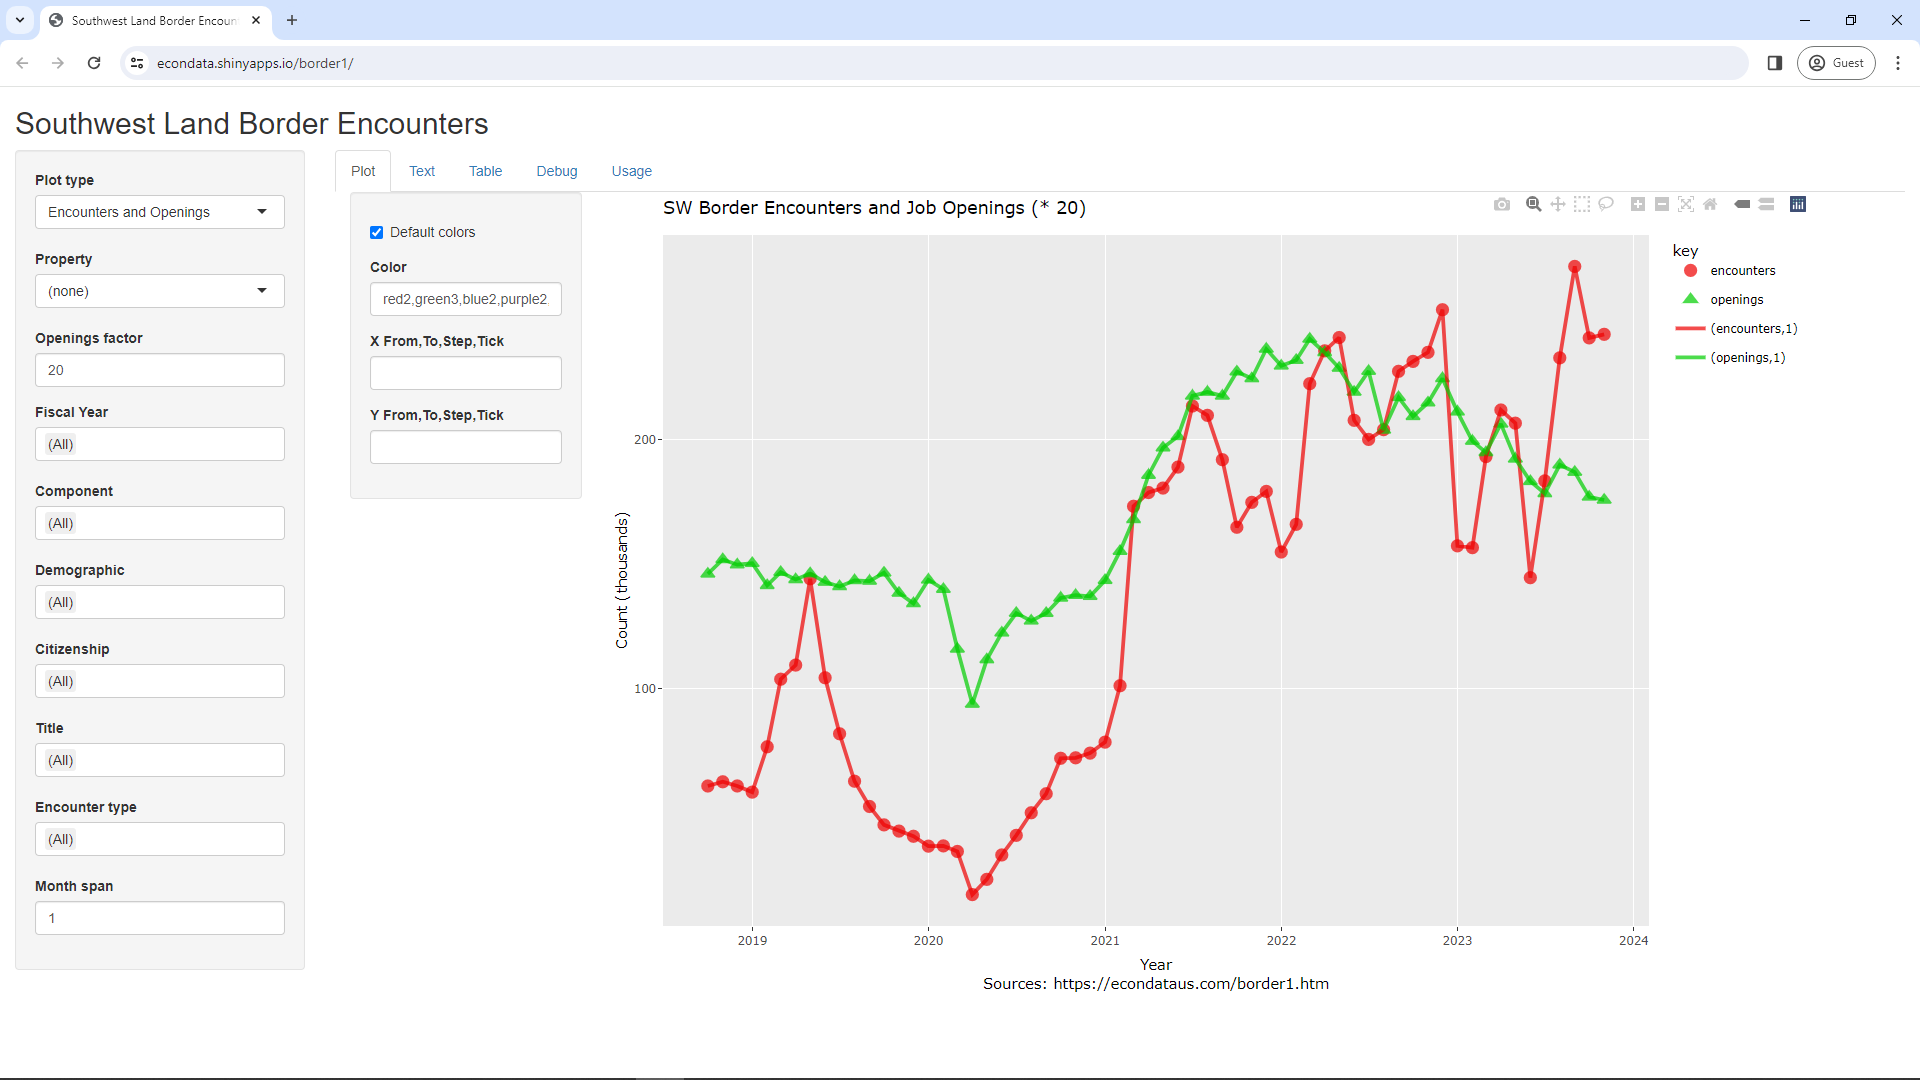
The job openings are multiplied by 20 (as set in "Openings factor") so that encounters and job openings can be shown on the same scale. As seen, there is now somewhat less correlation. Both variables did dip just after the start of COVID in April of 2020 and rise after that. However, job openings reached a peak in March of 2022 and began to fall while border encounters continued to generally rise, hitting a peak in September of 2023. It would seem that there may well be other equally important factors, including COVID, any changes in policies, and other factors mentioned in the media such as increased migration from other countries due to increased problems in those countries. An example of what happens when some of those other factors are filtered out are shown in the next section.
Filtering Data on Southwest Land Border Encounters by Property
The data in any of the charts can be filtered using the select boxes on the left sidebar following "Openings factor". Multiple selections can be made in those select boxes. However, the "(All)" selection must be removed for those other selections to take effect. Otherwise, all selections will continue to be included. For example, follow the steps below:
The above steps effectively remove the effects of Other countries and Title 42. As can be seen, there no longer appears to be any correlation between border encounters and job openings.