Click here to go to the app that generates the following graphs
Graphs based on data from the U.S. Budget, FY 2017: 1940-2021
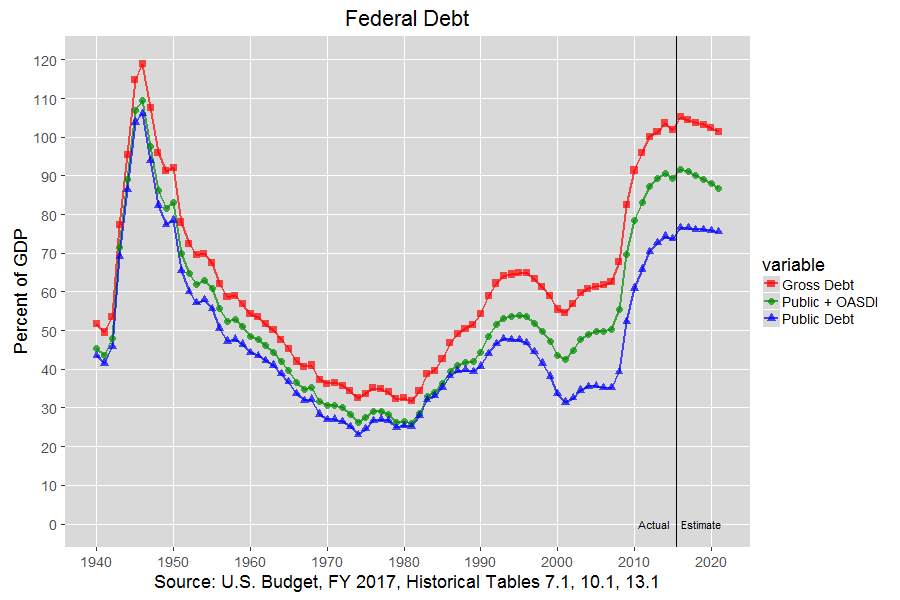
Federal Debt: Data
Interactive Graph
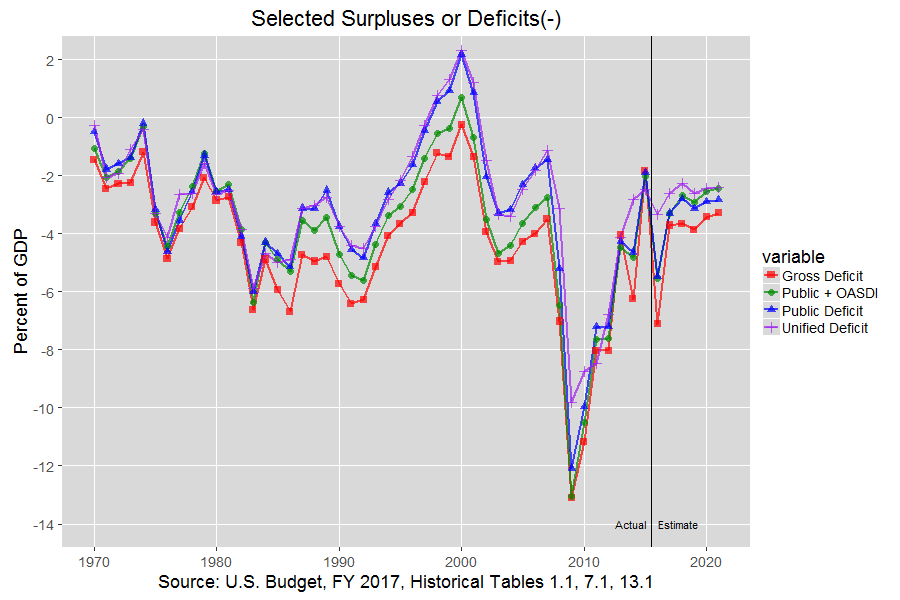
Selected Surpluses or Deficits(-): Data
Interactive Graph
The parameters for the interactive graphs can be modified after checking "Ignore URL Parameters".
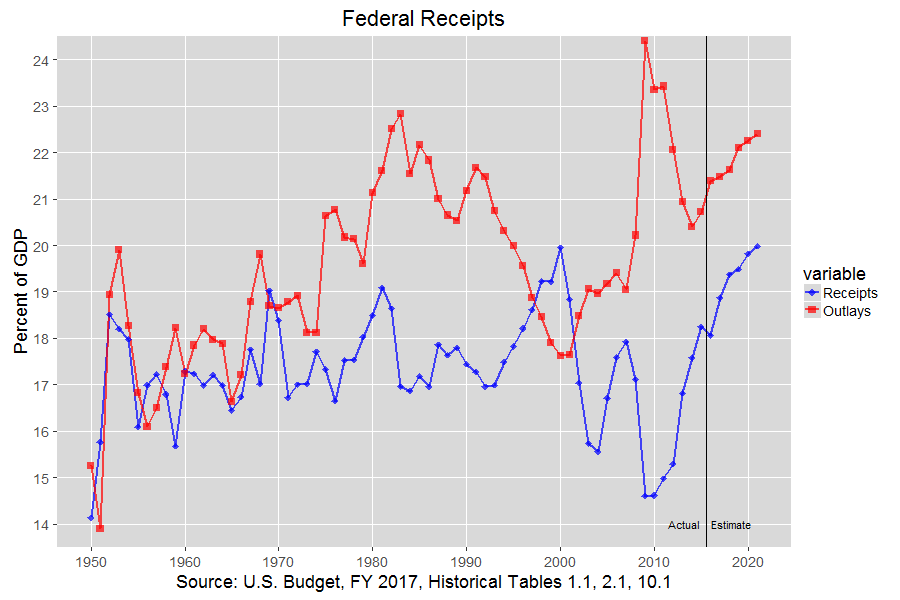
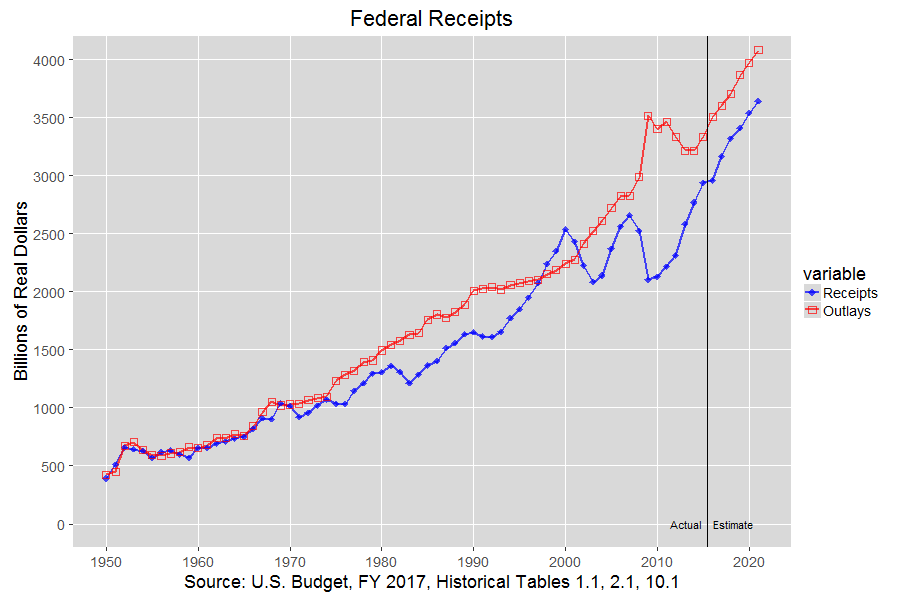
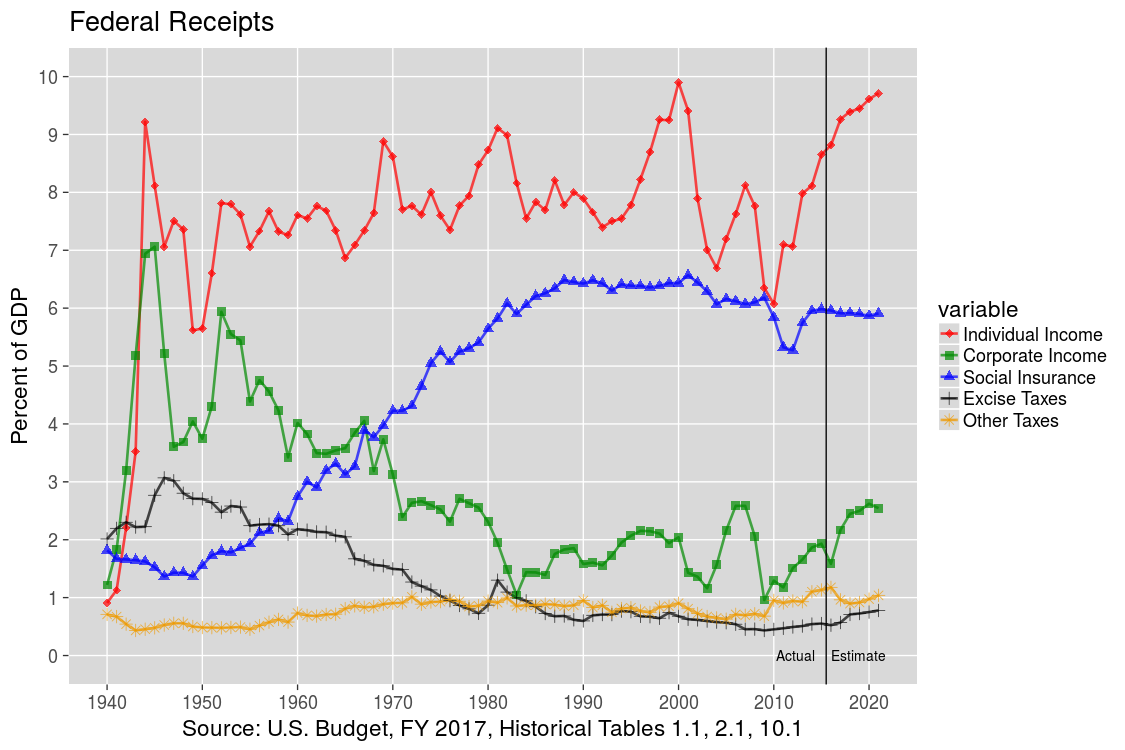
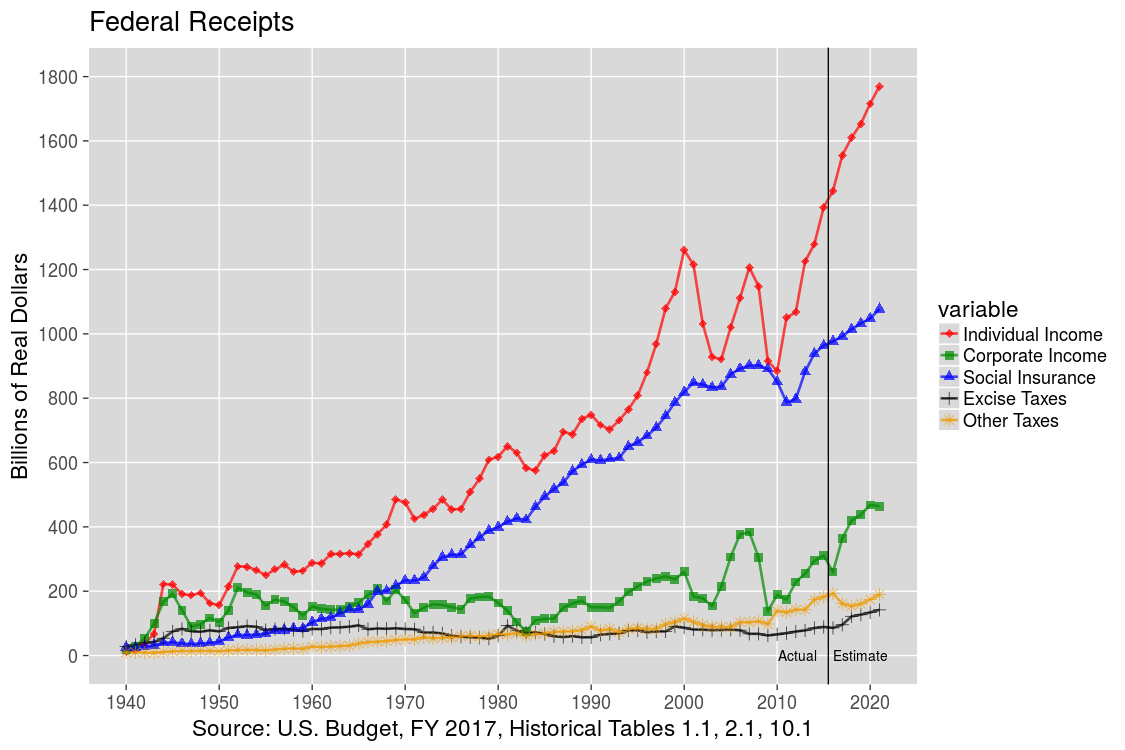
Federal Receipts: Data
Interactive Graphs:
Receipts and Outlays as Percent of GDP ,
Receipts and Outlays in Real Dollars ,
Receipts by Source as Percent of GDP ,
and Receipts by Source in Real Dollars
The parameters for the interactive graphs can be modified after checking "Ignore URL Parameters".

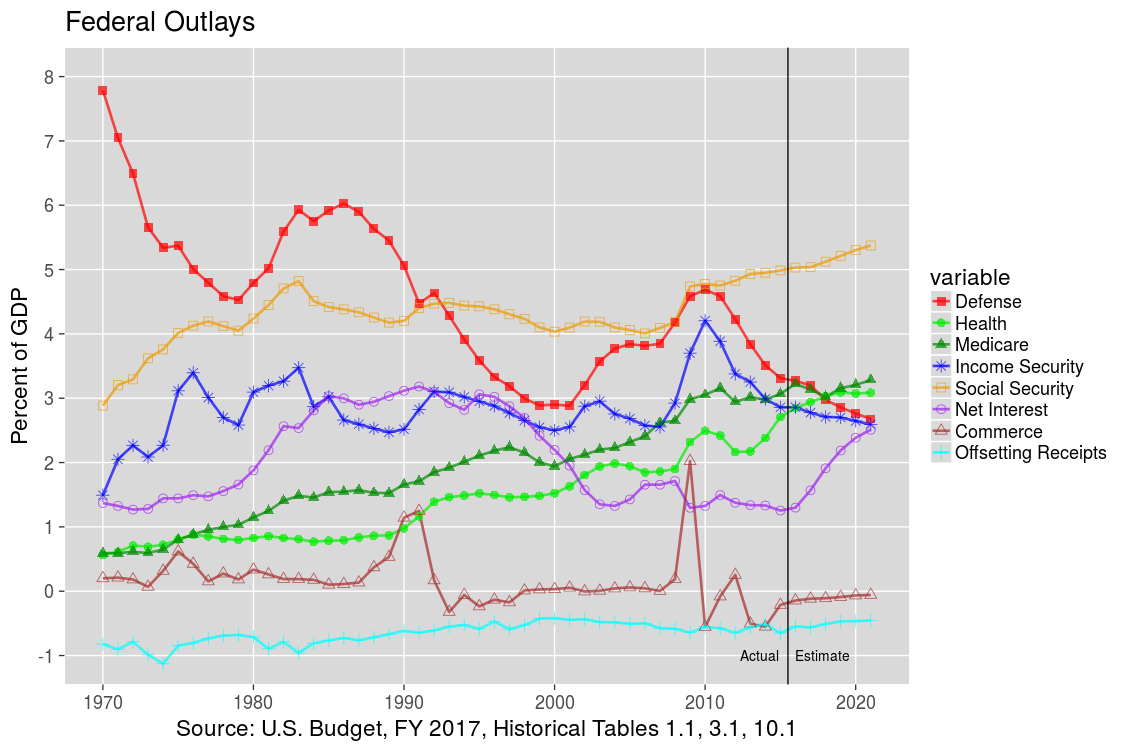
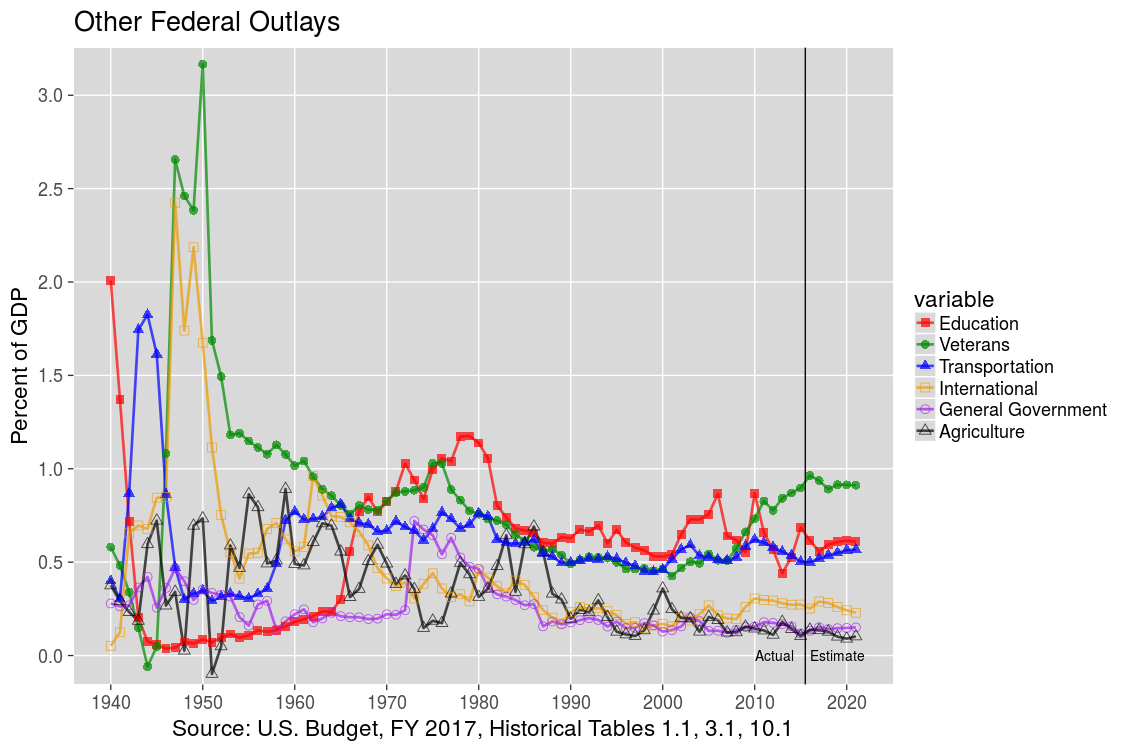
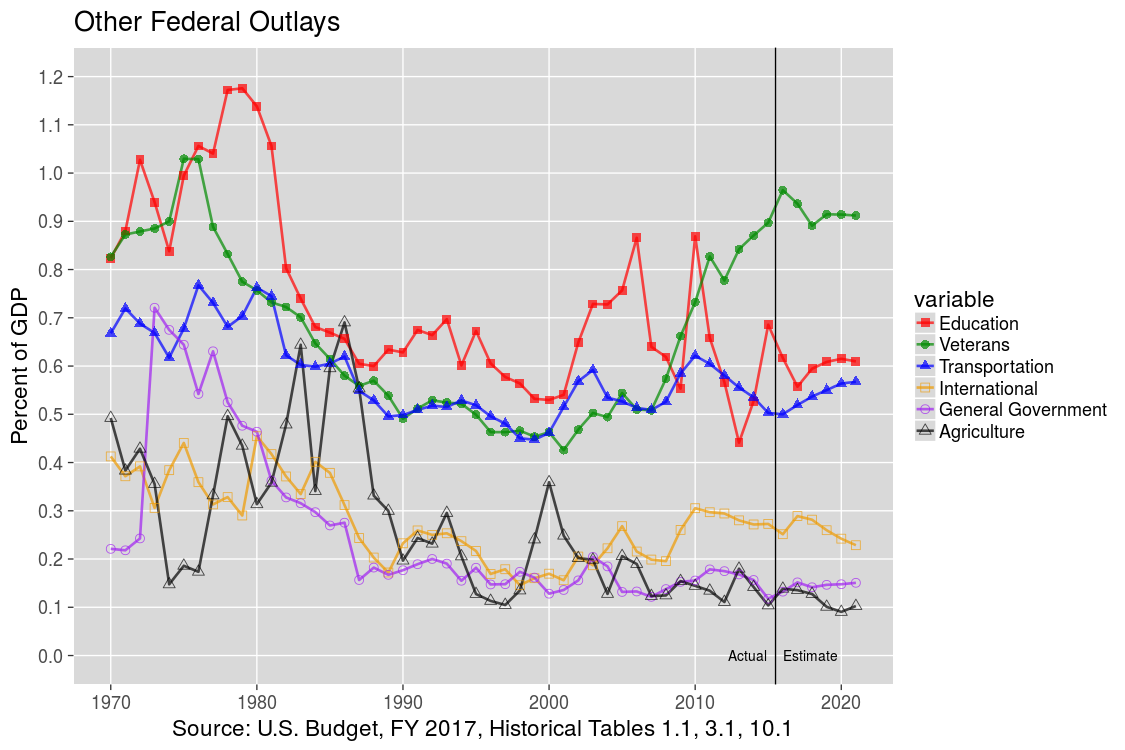
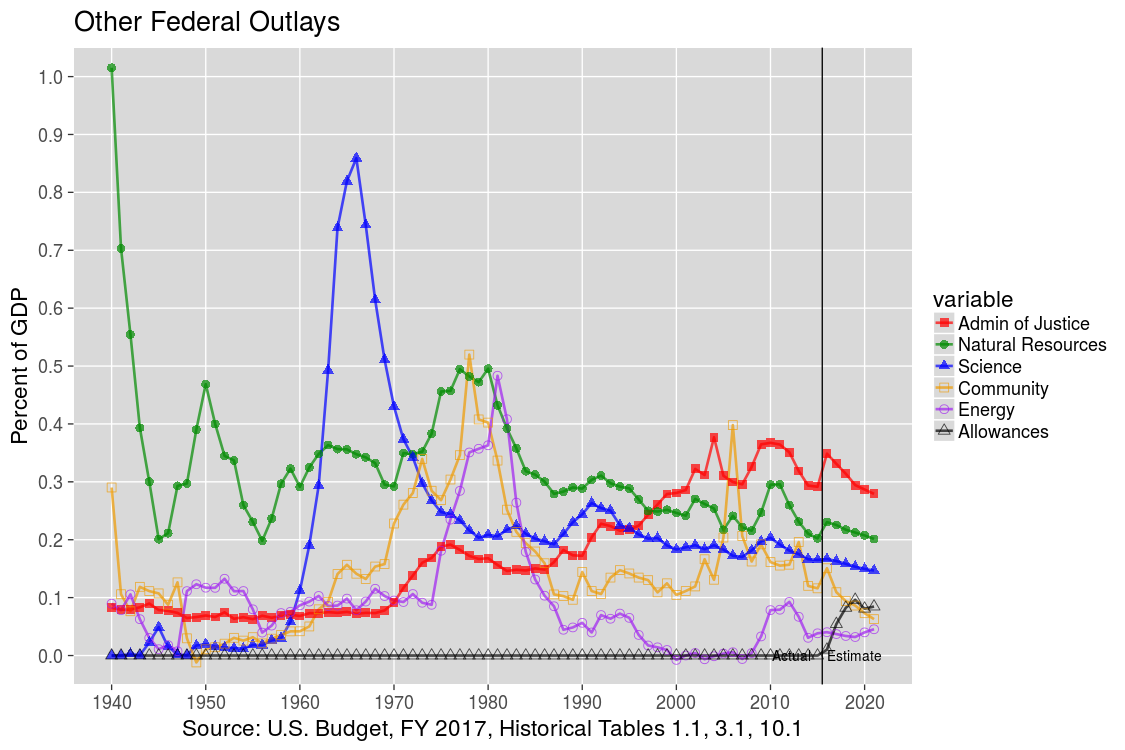
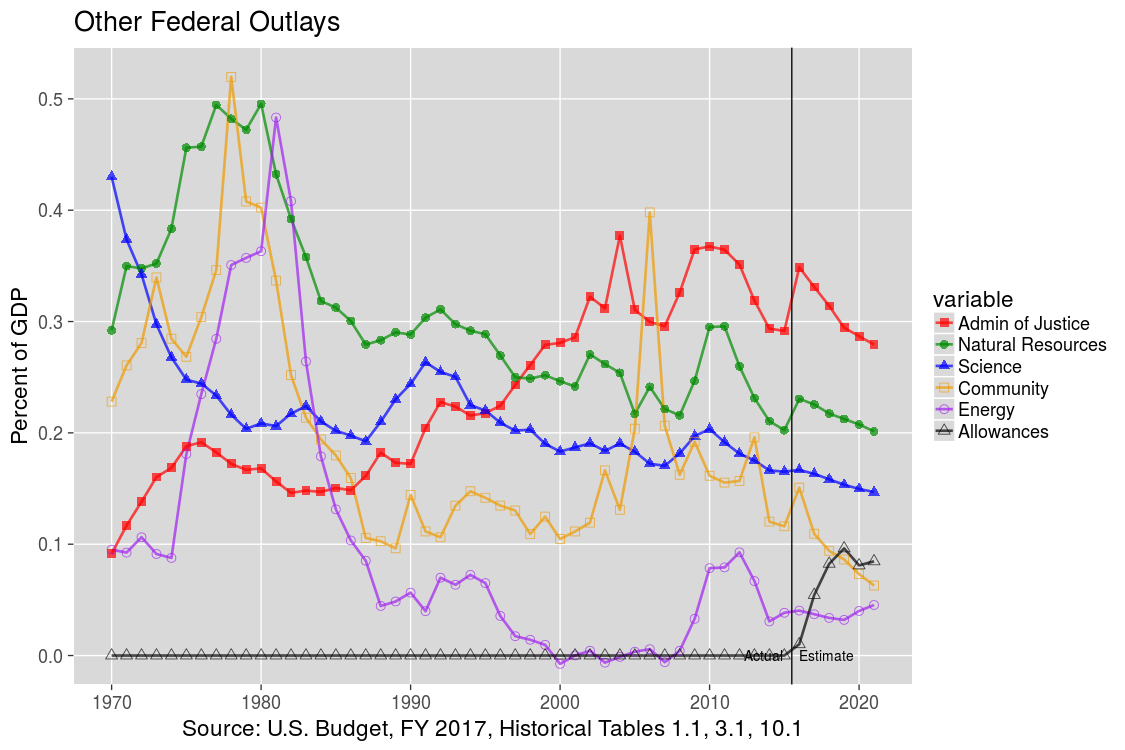
Federal Outlays: Data
Interactive Graphs:
Top Outlays, 1940-2021,
Top Outlays, 1970-2021,
Next Outlays, 1940-2021,
Next Outlays, 1970-2021,
Other Outlays, 1940-2021,
and Other Outlays, 1970-2021
The parameters for the interactive graphs can be modified after checking "Ignore URL Parameters".
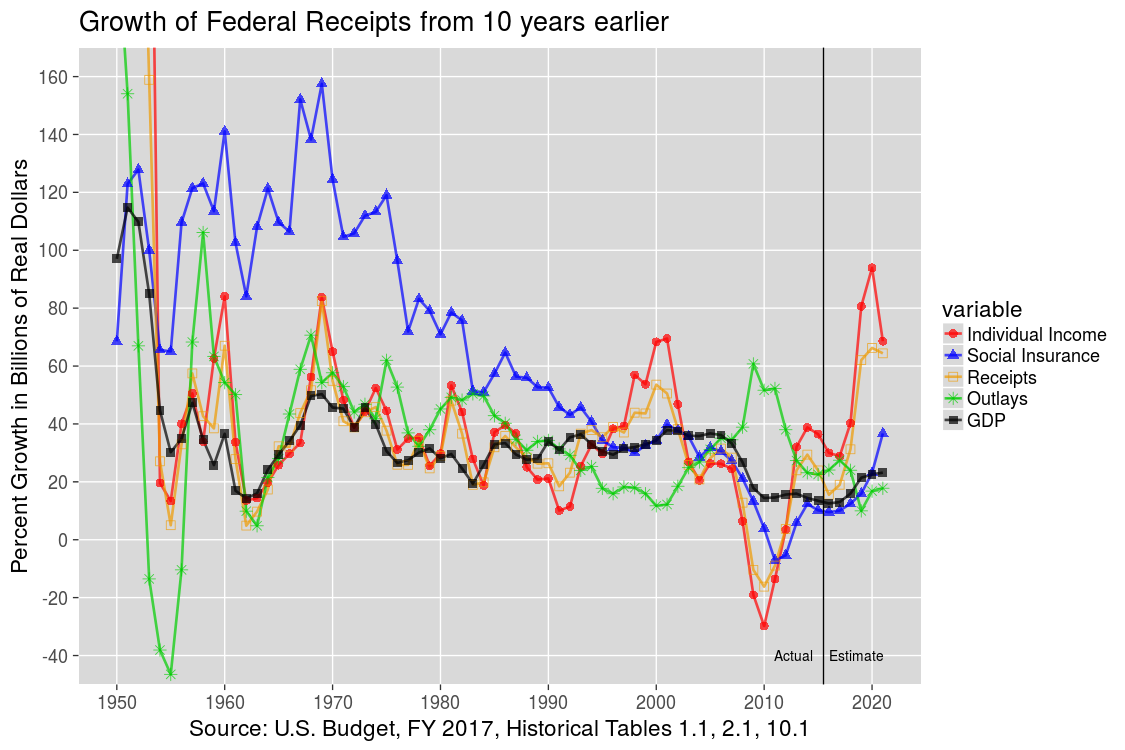
Growth from 10 Years Earlier: Data
Interactive Graph
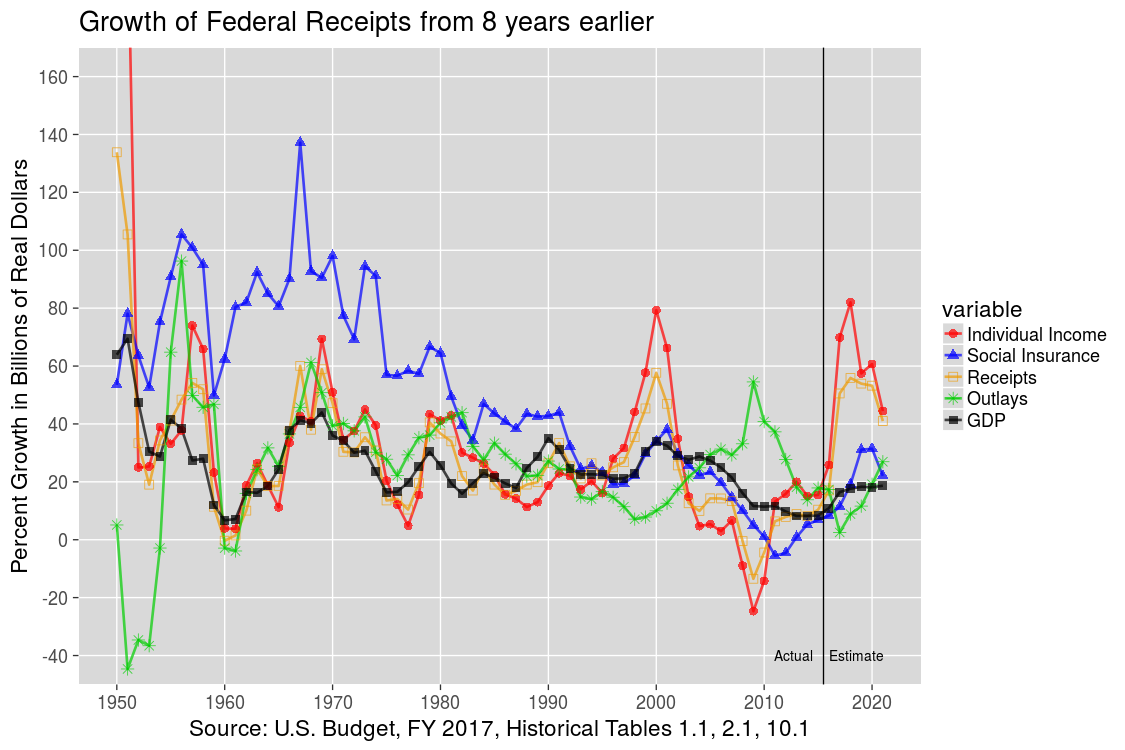
Growth from 8 Years Earlier: Data
Interactive Graph
The parameters for the interactive graphs can be modified after checking "Ignore URL Parameters".
Source: Budget of the United States Government, FY 2017: Historical Tables,
tables 1.1, 2.1, 3.1, 7.1, 10.1, and 13.1
Go to Budget Home Page