CALIFORNIA BUDGET REVENUES AND EXPENDITURES
(billions of dollars)
Expenditures
--------------------------------------------------------------
Start of General
Fiscal General Special Bond Federal plus plus plus
Year Revenues Fund Funds Funds Funds Special Bonds Federal
-------- -------- -------- -------- -------- -------- -------- -------- --------
1976 11.284 10.371 2.041 0.123 7.992 12.412 12.535 20.527
1977 13.623 11.613 2.161 0.157 7.239 13.774 13.931 21.170
1978 15.104 16.136 2.298 0.196 7.453 18.434 18.630 26.083
1979 17.872 18.421 2.760 0.193 8.160 21.181 21.374 29.535
1980 18.790 20.872 3.262 0.145 10.248 24.133 24.278 34.526
1981 20.824 21.445 3.099 0.230 10.863 24.544 24.774 35.637
1982 20.943 21.462 3.180 0.399 12.255 24.642 25.040 37.295
1983 23.516 22.575 3.527 0.400 12.454 26.103 26.503 38.957
1984 26.281 25.466 4.651 0.588 13.372 30.118 30.706 44.078
1985 27.802 28.571 5.190 0.945 14.280 33.761 34.706 48.987
1986 32.277 31.227 5.650 0.961 14.745 36.877 37.838 52.583
1987 32.265 32.752 6.014 1.303 14.950 38.766 40.068 55.018
1988 36.648 35.764 6.223 2.514 16.626 41.987 44.501 61.127
1989 38.750 39.456 7.872 1.266 18.659 47.328 48.594 67.253
1990 38.214 40.264 8.563 2.619 21.484 48.826 51.446 72.929
1991 42.027 43.327 11.193 1.761 26.722 54.520 56.280 83.002
1992 40.947 40.948 11.652 3.880 29.583 52.600 56.480 86.063
1993 40.095 38.958 12.747 1.379 32.554 51.704 53.083 85.637
1994 42.710 41.962 11.943 0.708 31.497 53.904 54.613 86.110
1995 46.296 45.393 12.541 1.937 30.340 57.934 59.870 90.210
1996 49.220 49.088 13.262 2.173 31.385 62.350 64.523 95.909
1997 54.973 52.874 14.202 1.452 31.649 67.076 68.528 100.177
1998 58.615 57.827 14.736 2.697 34.375 72.563 75.260 109.635
1999 71.931 66.494 15.787 2.583 37.303 82.281 84.864 122.167
2000 71.428 78.053 13.972 4.357 41.273 92.024 96.382 137.654
2001 72.239 76.752 19.448 3.020 46.623 96.200 99.220 145.843
2002 80.564 77.482 18.282 11.015 54.733 95.764 106.779 161.511
2003 76.774 78.345 18.892 6.986 52.420 97.237 104.223 156.643
2004 82.210 79.804 22.192 5.596 52.122 101.996 107.591 159.713
2005 93.427 91.592 22.716 5.304 53.569 114.308 119.612 173.181
2006 95.415 101.413 22.554 6.001 52.935 123.967 129.968 182.903
2007 102.574 102.986 26.674 8.405 56.211 129.660 138.065 194.276
2008* 89.373 94.089 26.441 15.638 66.577 120.530 136.168 202.745
2009* 97.729 92.206 32.214 6.978 67.001 124.420 131.398 198.398
-----------------------------------------------------------------------------------------
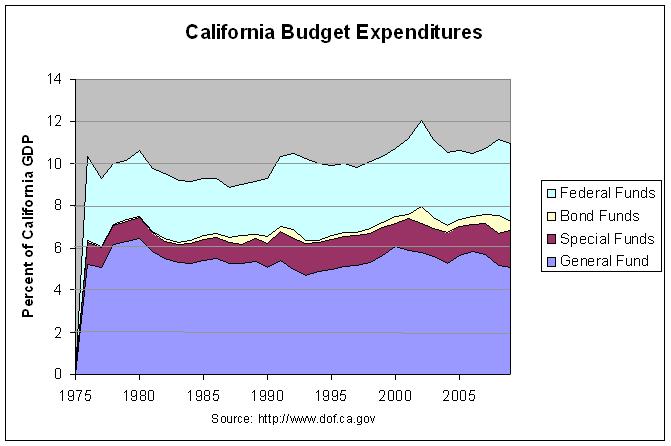
CALIFORNIA BUDGET REVENUES AND EXPENDITURES
(percent of California GDP)
Expenditures
--------------------------------------------------------------
Start of General California
Fiscal General Special Bond Federal plus plus plus GDP
Year Revenues Fund Funds Funds Funds Special Bonds Federal ($bill)
-------- -------- -------- -------- -------- -------- -------- -------- -------- --------
1976 5.24 1.03 0.06 4.04 6.27 6.34 10.37 198
1977 5.08 0.95 0.07 3.17 6.03 6.10 9.26 229
1978 6.17 0.88 0.08 2.85 7.05 7.13 9.98 261
1979 6.31 0.95 0.07 2.80 7.26 7.32 10.12 292
1980 6.43 1.01 0.04 3.16 7.44 7.48 10.64 324
1981 5.87 0.85 0.06 2.97 6.72 6.78 9.76 365
1982 5.50 0.82 0.10 3.14 6.32 6.42 9.56 390
1983 5.33 0.83 0.09 2.94 6.16 6.25 9.19 424
1984 5.27 0.96 0.12 2.77 6.23 6.35 9.12 483
1985 5.41 0.98 0.18 2.70 6.39 6.57 9.28 528
1986 5.49 0.99 0.17 2.59 6.49 6.66 9.25 568
1987 5.28 0.97 0.21 2.41 6.25 6.46 8.87 620
1988 5.27 0.92 0.37 2.45 6.19 6.56 9.01 679
1989 5.37 1.07 0.17 2.54 6.44 6.62 9.16 734
1990 5.11 1.09 0.33 2.73 6.19 6.53 9.25 788
1991 5.41 1.40 0.22 3.34 6.80 7.02 10.36 801
1992 5.00 1.42 0.47 3.61 6.42 6.89 10.50 819
1993 4.67 1.53 0.17 3.90 6.20 6.37 10.27 834
1994 4.87 1.38 0.08 3.65 6.25 6.33 9.98 862
1995 4.99 1.38 0.21 3.34 6.37 6.59 9.92 909
1996 5.12 1.38 0.23 3.27 6.51 6.73 10.01 958
1997 5.19 1.39 0.14 3.11 6.58 6.72 9.83 1019
1998 5.33 1.36 0.25 3.17 6.68 6.93 10.10 1086
1999 5.63 1.34 0.22 3.16 6.97 7.19 10.35 1181
2000 6.06 1.09 0.34 3.21 7.15 7.49 10.69 1287
2001 5.90 1.49 0.23 3.58 7.39 7.63 11.21 1301
2002 5.78 1.36 0.82 4.08 7.14 7.97 12.05 1340
2003 5.57 1.34 0.50 3.73 6.91 7.41 11.14 1407
2004 5.25 1.46 0.37 3.43 6.71 7.08 10.51 1519
2005 5.61 1.39 0.32 3.28 7.00 7.33 10.61 1633
2006 5.82 1.29 0.34 3.04 7.12 7.46 10.50 1742
2007 5.68 1.47 0.46 3.10 7.15 7.62 10.72 1813
2008* 5.19 1.46 0.86 3.67 6.65 7.51 11.18 1813^
2009* 5.09 1.78 0.38 3.70 6.86 7.25 10.94 1813^
-----------------------------------------------------------------------------------------
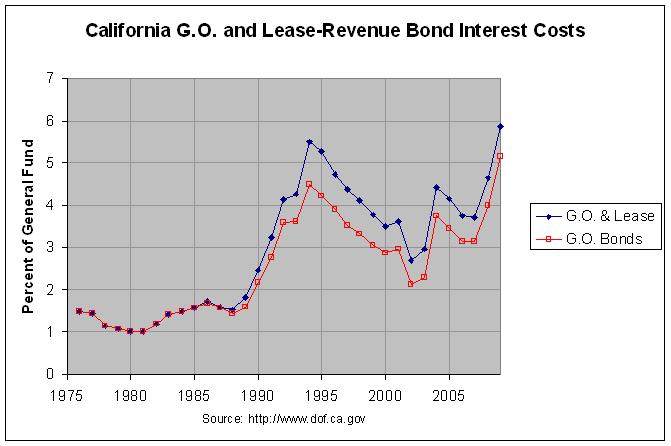
CALIFORNIA GENERAL OBLIGATION AND LEASE-REVENUE BOND INTEREST COSTS
(billions of dollars)
As a percent of
GF Expenditures
-----------------
Start of G.O. plus G.O. plus
Fiscal General Bond Lease Bond Lease
Year Revenues Fund Costs Payments Costs Payments
-------- -------- -------- -------- -------- -------- --------
1976 11.284 10.371 0.153 0.153 1.47 1.47
1977 13.623 11.613 0.166 0.166 1.43 1.43
1978 15.104 16.136 0.186 0.186 1.15 1.15
1979 17.872 18.421 0.197 0.197 1.07 1.07
1980 18.790 20.872 0.210 0.210 1.01 1.01
1981 20.824 21.445 0.218 0.218 1.02 1.02
1982 20.943 21.462 0.258 0.258 1.20 1.20
1983 23.516 22.575 0.318 0.318 1.41 1.41
1984 26.281 25.466 0.376 0.376 1.48 1.48
1985 27.802 28.571 0.452 0.452 1.58 1.58
1986 32.277 31.227 0.527 0.539 1.69 1.73
1987 32.265 32.752 0.512 0.525 1.56 1.60
1988 36.648 35.764 0.514 0.549 1.44 1.53
1989 38.750 39.456 0.630 0.715 1.60 1.81
1990 38.214 40.264 0.872 0.991 2.17 2.46
1991 42.027 43.327 1.198 1.405 2.77 3.24
1992 40.947 40.948 1.468 1.687 3.59 4.12
1993 40.095 38.958 1.407 1.663 3.61 4.27
1994 42.710 41.962 1.879 2.305 4.48 5.49
1995 46.296 45.393 1.911 2.394 4.21 5.27
1996 49.220 49.088 1.919 2.328 3.91 4.74
1997 54.973 52.874 1.865 2.318 3.53 4.38
1998 58.615 57.827 1.913 2.371 3.31 4.10
1999 71.931 66.494 2.026 2.504 3.05 3.77
2000 71.428 78.053 2.239 2.728 2.87 3.50
2001 72.239 76.752 2.282 2.769 2.97 3.61
2002 80.564 77.482 1.661 2.091 2.14 2.70
2003 76.774 78.345 1.798 2.318 2.29 2.96
2004 82.210 79.804 2.984 3.520 3.74 4.41
2005 93.427 91.592 3.171 3.793 3.46 4.14
2006 95.415 101.413 3.190 3.802 3.15 3.75
2007 102.574 102.986 3.237 3.817 3.14 3.71
2008* 89.373 94.089 3.698 4.292 4.00 4.64
2009* 97.729 92.206 4.916 5.591 5.15 5.85
* estimated
^ 2007 California GDP used for 2008 and 2009 as estimates for those
years were not available.
Note: Revenues and expenditures through 2007 are actual. According to
Chart G, expenditures for 2008 are "as a result of Chapter 2,
Statutes of 2009, Third Extraordinary Session" and expenditures
for 2009 are "as of the 2009 February Budget Act".
Source: California Department of Finance, Summary Schedules,
Charts A-1, B, K-1, and K-3;
Bureau of Economic Analysis, Gross Domestic Product by State
Go to Budget Home Page
