REVENUES, OUTLAYS, AND DEFICITS (-) OR SURPLUSES
(in Billions of Dollars) Total, Total,
Actual 2010- 2010-
2008 2009 2010 2011 2012 2013 2014 2015 2016 2017 2018 2019 2014 2019
----- ----- ----- ----- ----- ----- ----- ----- ----- ----- ----- ----- ------ ------
Revenues 2524 2357 2533 2825 3124 3353 3544 3746 3929 4122 4309 4505 15380 35991
Outlays 2978 3543 3236 3323 3388 3610 3794 3980 4201 4355 4497 4740 17351 39126
----- ----- ----- ----- ----- ----- ----- ----- ----- ----- ----- ----- ------ ------
Deficit(-) -455 -1186 -703 -498 -264 -257 -250 -234 -272 -234 -188 -235 -1972 -3135
On-budget -638 -1340 -843 -641 -412 -413 -411 -398 -434 -393 -342 -381 -2721 -4668
Off-budget 183 155 140 143 149 156 162 164 162 159 154 146 749 1534
Other means of financing
-313 -204 67 89 27 215 32 42 48 48 396 18 431 984
Change in Debt Held By the Public
-767 -1390 -636 -410 -236 -42 -217 -192 -224 -185 208 -217 -1541 -2151
Change in Gross Federal Debt
-1035 -1543 -794 -602 -486 -300 -478 -450 -454 -415 -26 -441 -2659 -4445
Extend Expiring Tax Provisions
0 -3 -24 -170 -291 -342 -378 -413 -448 -486 -526 -568 -1205 -3646
Reform the Alternative Minimum Tax
0 -7 -81 -60 -36 -45 -55 -67 -80 -94 -112 -131 -278 -763
-------------------------------------------------------------------------------------------------
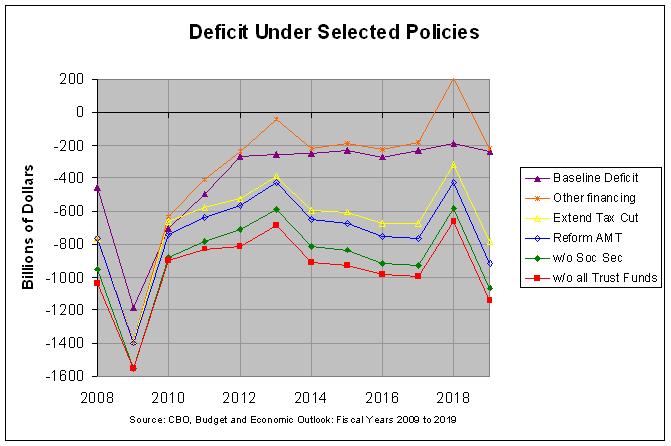
DEFICITS UNDER SELECTED POLICY ALTERNATIVES
(in Billions of Dollars) Total, Total,
Actual 2010- 2010-
2008 2009 2010 2011 2012 2013 2014 2015 2016 2017 2018 2019 2014 2019
----- ----- ----- ----- ----- ----- ----- ----- ----- ----- ----- ----- ------ ------
Baseline Deficit(-) or Surplus
-455 -1186 -703 -498 -264 -257 -250 -234 -272 -234 -188 -235 -1972 -3135
plus Other means of financing
-768 -1390 -636 -410 -236 -42 -217 -192 -224 -185 208 -217 -1541 -2151
plus Extend Expiring Tax Provisions
-768 -1393 -660 -579 -527 -384 -596 -604 -672 -671 -318 -786 -2746 -5797
plus Reform the Alternative Minimum Tax
-768 -1400 -741 -639 -563 -429 -651 -672 -752 -766 -429 -917 -3024 -6560
minus Off-budget surplus
-951 -1554 -881 -782 -711 -585 -813 -835 -914 -925 -583 -1063 -3773 -8093
minus all trust fund surpluses
-1035 -1552 -899 -831 -812 -688 -912 -930 -982 -995 -663 -1141 -4142 -8853
Gross Domestic Product
14224 14257 14452 15137 16048 17035 17986 18864 19703 20537 21397 22278 80659 183438
-------------------------------------------------------------------------------------------------
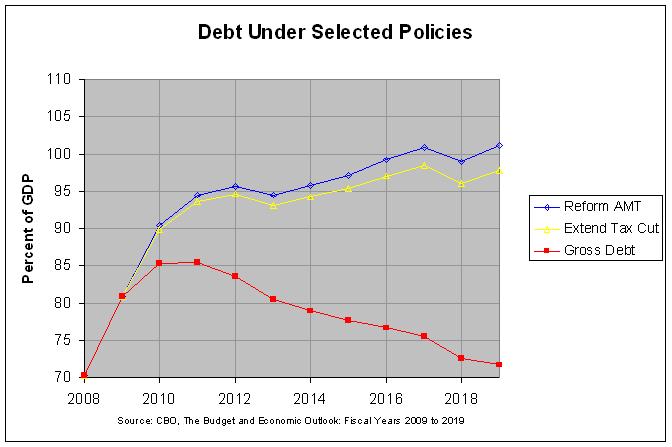
DEBTS UNDER SELECTED POLICY ALTERNATIVES
(in Billions of Dollars)
Actual
2008 2009 2010 2011 2012 2013 2014 2015 2016 2017 2018 2019
----- ----- ----- ----- ----- ----- ----- ----- ----- ----- ----- -----
Debt Held By the Public
5803 7193 7829 8238 8475 8516 8734 8925 9149 9335 9127 9344
Gross Federal Debt
9986 11529 12323 12924 13410 13710 14188 14638 15092 15506 15532 15973
plus Extend Expiring Tax Provisions
9986 11529 12982 14163 15176 15860 16934 17988 19114 20200 20543 21770
plus Reform the Alternative Minimum Tax
9986 11529 13064 14305 15353 16083 17212 18333 19539 20720 21174 22533
Gross Domestic Product
14224 14257 14452 15137 16048 17035 17986 18864 19703 20537 21397 22278
-------------------------------------------------------------------------------------------------
OTHER MEANS OF FINANCING: BORROWING (-) OR REPAYMENT
(in Billions of Dollars) Total, Total,
Actual 2010- 2010-
2008 2009 2010 2011 2012 2013 2014 2015 2016 2017 2018 2019 2014 2019
----- ----- ----- ----- ----- ----- ----- ----- ----- ----- ----- ----- ------ ------
TARP 0 -461 20 91 33 218 31 31 31 31 378 0 393 866
Fannie Mae and Freddie Mac
0 221 6 1 -2 1 4 10 13 13 13 14 11 74
MBS Purchase Programs
-5 -248 23 23 23 23 23 23 23 23 23 23 116 233
Change in Cash Balances
-296 297 40 0 0 0 0 0 0 0 0 0 40 40
Other
-12 -13 -23 -26 -27 -27 -26 -22 -20 -20 -19 -19 -130 -230
----------- ----- ----- ----- ----- ----- ----- ----- ----- ----- ----- ----- ----- ------ ------
Total -313 -204 67 89 27 215 32 42 48 48 396 18 431 984
=================================================================================================
REVENUES, OUTLAYS, AND DEFICITS (-) OR SURPLUSES
(as Percentage of GDP) Total, Total,
Actual 2010- 2010-
2008 2009 2010 2011 2012 2013 2014 2015 2016 2017 2018 2019 2014 2019
----- ----- ----- ----- ----- ----- ----- ----- ----- ----- ----- ----- ------ ------
Revenues 17.7 16.5 17.5 18.7 19.5 19.7 19.7 19.9 19.9 20.1 20.1 20.2 19.1 19.6
Outlays 20.9 24.9 22.4 22.0 21.1 21.2 21.1 21.1 21.3 21.2 21.0 21.3 21.5 21.3
----- ----- ----- ----- ----- ----- ----- ----- ----- ----- ----- ----- ------ ------
Deficit(-) -3.2 -8.3 -4.9 -3.3 -1.6 -1.5 -1.4 -1.2 -1.4 -1.1 -0.9 -1.1 -2.4 -1.7
On-budget -4.5 -9.4 -5.8 -4.2 -2.6 -2.4 -2.3 -2.1 -2.2 -1.9 -1.6 -1.7 -3.4 -2.5
Off-budget 1.3 1.1 1.0 0.9 0.9 0.9 0.9 0.9 0.8 0.8 0.7 0.7 0.9 0.8
Other means of financing
-2.2 -1.4 0.5 0.6 0.2 1.3 0.2 0.2 0.2 0.2 1.9 0.1 0.5 0.5
Change in Debt Held By the Public
-5.4 -9.7 -4.4 -2.7 -1.5 -0.2 -1.2 -1.0 -1.1 -0.9 1.0 -1.0 -1.9 -1.2
Change in Gross Federal Debt
-7.3 -10.8 -5.5 -4.0 -3.0 -1.8 -2.7 -2.4 -2.3 -2.0 -0.1 -2.0 -3.3 -2.4
Extend Expiring Tax Provisions
0.0 0.0 -0.2 -1.1 -1.8 -2.0 -2.1 -2.2 -2.3 -2.4 -2.5 -2.6 -1.5 -2.0
Reform the Alternative Minimum Tax
0.0 0.0 -0.6 -0.4 -0.2 -0.3 -0.3 -0.4 -0.4 -0.5 -0.5 -0.6 -0.3 -0.4
-------------------------------------------------------------------------------------------------
DEFICITS UNDER SELECTED POLICY ALTERNATIVES
(as Percentage of GDP) Total, Total,
Actual 2010- 2010-
2008 2009 2010 2011 2012 2013 2014 2015 2016 2017 2018 2019 2014 2019
----- ----- ----- ----- ----- ----- ----- ----- ----- ----- ----- ----- ------ ------
Baseline Deficit(-) or Surplus
-3.2 -8.3 -4.9 -3.3 -1.6 -1.5 -1.4 -1.2 -1.4 -1.1 -0.9 -1.1 -2.4 -1.7
plus Other means of financing
-5.4 -9.7 -4.4 -2.7 -1.5 -0.2 -1.2 -1.0 -1.1 -0.9 1.0 -1.0 -1.9 -1.2
plus Extend Expiring Tax Provisions
-5.4 -9.8 -4.6 -3.8 -3.3 -2.3 -3.3 -3.2 -3.4 -3.3 -1.5 -3.5 -3.4 -3.2
plus Reform the Alternative Minimum Tax
-5.4 -9.8 -5.1 -4.2 -3.5 -2.5 -3.6 -3.6 -3.8 -3.7 -2.0 -4.1 -3.7 -3.6
minus Off-budget surplus
-6.7 -10.9 -6.1 -5.2 -4.4 -3.4 -4.5 -4.4 -4.6 -4.5 -2.7 -4.8 -4.7 -4.4
minus all trust fund surpluses
-7.3 -10.9 -6.2 -5.5 -5.1 -4.0 -5.1 -4.9 -5.0 -4.8 -3.1 -5.1 -5.1 -4.8
Gross Domestic Product
14224 14257 14452 15137 16048 17035 17986 18864 19703 20537 21397 22278 80659 183438
-------------------------------------------------------------------------------------------------
DEBTS UNDER SELECTED POLICY ALTERNATIVES
(as Percentage of GDP)
Actual
2008 2009 2010 2011 2012 2013 2014 2015 2016 2017 2018 2019
----- ----- ----- ----- ----- ----- ----- ----- ----- ----- ----- -----
Debt Held By the Public
40.8 50.5 54.2 54.4 52.8 50.0 48.6 47.3 46.4 45.5 42.7 41.9
Gross Federal Debt
70.2 80.9 85.3 85.4 83.6 80.5 78.9 77.6 76.6 75.5 72.6 71.7
plus Extend Expiring Tax Provisions
70.2 80.9 89.8 93.6 94.6 93.1 94.1 95.4 97.0 98.4 96.0 97.7
plus Reform the Alternative Minimum Tax
70.2 80.9 90.4 94.5 95.7 94.4 95.7 97.2 99.2 100.9 99.0 101.1
Gross Domestic Product
14224 14257 14452 15137 16048 17035 17986 18864 19703 20537 21397 22278
-------------------------------------------------------------------------------------------------
OTHER MEANS OF FINANCING: BORROWING (-) OR REPAYMENT
(as Percentage of GDP) Total, Total,
Actual 2010- 2010-
2008 2009 2010 2011 2012 2013 2014 2015 2016 2017 2018 2019 2014 2019
----- ----- ----- ----- ----- ----- ----- ----- ----- ----- ----- ----- ------ ------
TARP 0.0 -3.2 0.1 0.6 0.2 1.3 0.2 0.2 0.2 0.2 1.8 0.0 0.5 0.5
Fannie Mae and Freddie Mac
0.0 1.6 0.0 0.0 0.0 0.0 0.0 0.1 0.1 0.1 0.1 0.1 0.0 0.0
MBS Purchase Programs
0.0 -1.7 0.2 0.2 0.1 0.1 0.1 0.1 0.1 0.1 0.1 0.1 0.1 0.1
Change in Cash Balances
-2.1 2.1 0.3 0.0 0.0 0.0 0.0 0.0 0.0 0.0 0.0 0.0 0.0 0.0
Other
-0.1 -0.1 -0.2 -0.2 -0.2 -0.2 -0.1 -0.1 -0.1 -0.1 -0.1 -0.1 -0.2 -0.1
----------- ----- ----- ----- ----- ----- ----- ----- ----- ----- ----- ----- ----- ------ ------
Total -2.2 -1.4 0.5 0.6 0.2 1.3 0.2 0.2 0.2 0.2 1.9 0.1 0.5 0.5
=================================================================================================
Source: The Budget and Economic Outlook: Fiscal Years 2009 to 2019, January 2009,
Congressional Budget Office,
PDF: http://www.cbo.gov/ftpdocs/99xx/doc9957/01-07-Outlook.pdf
data: http://www.cbo.gov/ftpdocs/99xx/doc9957/selected_tables.xls
Go to Budget Home Page
