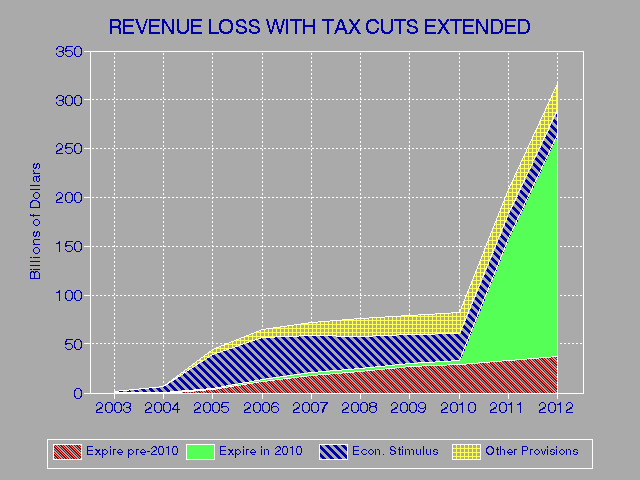


              EFFECTS ON REVENUES OF EXTENDING EXPIRING TAX PROVISIONS
                          (in billions of dollars)
                                                                          Total, Total,
               2003  2004  2005  2006  2007  2008  2009  2010  2011  2012  03-07  03-12
-------------  ----  ----  ----  ----  ----  ----  ----  ----  ----  ----  -----  -----
Provisions in the EGTRRA expiring...
 before 2010~  n.a.  n.a.    -3   -12   -18   -22   -27   -29   -33   -37    -33   -181
 in 2010         -1    -1    -2    -2    -3    -3    -3    -4  -125  -228     -9   -371
New Provisions in the Economic Stimulus Law^
                 -1    -6   -35   -43   -38   -34   -30   -28   -26   -25   -122   -264
Other Expiring Tax Provisions*
                  0    -1    -5    -9   -14   -18   -20   -22   -25   -27    -29   -140
-------------  ----  ----  ----  ----  ----  ----  ----  ----  ----  ----  -----  -----
Total Effect     -1    -8   -45   -67   -72   -77   -79   -83  -208  -317   -194   -956

~ The Economic Growth and Tax Relief Reconciliation Act of 2001 includes:
  1) increased exemption amount for alternative minimum tax (expires in 2004),
  2) deduction for qualified education expenses (expires in 2005),
  3) credit for IRA accounts and 401(k)-type plans (expires in 2006)
  4) numerous provisions expiring in 2010
^ The Job Creation and Worker Assistance Act of 2002 includes:
  1) special depreciation-expensing allowances for certain property,
  2) a five-year carryback of net operating losses,
  3) tax benefits for the area of New York City damaged in the 9-11 attacks
* Other expiring tax provisions includes numerous provisions, such as the
  tax credit for research and experimentation.


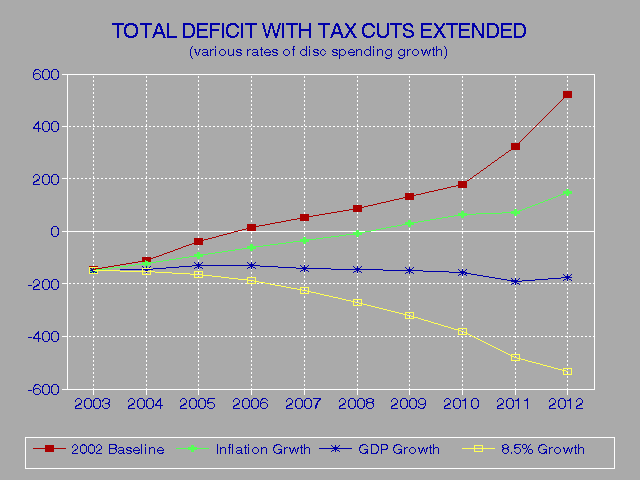
              DEFICITS, REVENUES, AND OUTLAYS UNDER VARIOUS ASSUMPTIONS
(revenue provisions are extended and disc. outlays grow at rate indicated)

                    Total Deficit (-) or Surplus (in billions of dollars)*
                                                                          Total, Total,
Growth Rate    2003  2004  2005  2006  2007  2008  2009  2010  2011  2012  03-07  03-12
-------------  ----  ----  ----  ----  ----  ----  ----  ----  ----  ----  -----  -----
2002 Baseline  -145  -111   -39    15    52    88   133   177   323   522   -229   1015
Inflation      -149  -124   -91   -62   -35    -8    29    63    74   147   -461   -156
GDP            -149  -144  -131  -132  -140  -146  -149  -158  -189  -176   -696  -1515
8.5 Percent    -149  -152  -163  -188  -225  -273  -320  -383  -481  -532   -878  -2867
0.4 Percent    -149  -115   -68   -21    26    75   135   195   234   337   -327    650
-8.5 Percent   -149   -76    27   135   244  n.a.  n.a.  n.a.  n.a.  n.a.    181   n.a.

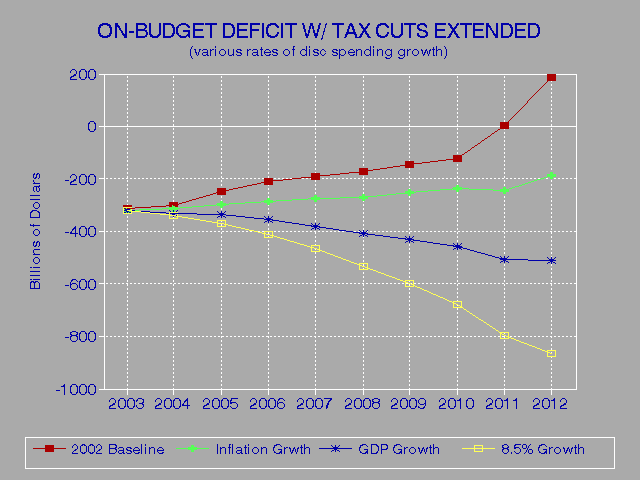
                    On-Budget Deficit (-) or Surplus (in billions of dollars)*
                                                                          Total, Total,
Growth Rate    2003  2004  2005  2006  2007  2008  2009  2010  2011  2012  03-07  03-12
-------------  ----  ----  ----  ----  ----  ----  ----  ----  ----  ----  -----  -----
2002 Baseline  -315  -299  -246  -209  -190  -173  -147  -122     4   185  -1259  -1513
Inflation      -319  -312  -298  -285  -277  -270  -251  -237  -244  -189  -1491  -2683
GDP            -319  -331  -337  -356  -382  -407  -428  -457  -507  -511  -1725  -4035
8.5 Percent    -319  -339  -369  -411  -466  -533  -599  -680  -797  -866  -1905  -5380
0.4 Percent    -319  -303  -275  -245  -216  -187  -145  -105   -85     0  -1358  -1881
-8.5 Percent   -319  -264  -180   -90     0  n.a.  n.a.  n.a.  n.a.  n.a.   -853   n.a.

                    Off-Budget Deficit (-) or Surplus (in billions of dollars)*
                                                                          Total, Total,
Growth Rate    2003  2004  2005  2006  2007  2008  2009  2010  2011  2012  03-07  03-12
-------------  ----  ----  ----  ----  ----  ----  ----  ----  ----  ----  -----  -----
2002 Baseline   170   188   207   224   242   262   280   299   319   337   1031   2527
Inflation       170   188   207   224   242   262   280   299   319   337   1031   2527
GDP             170   188   206   223   242   261   279   298   318   335   1029   2520
8.5 Percent     170   187   206   223   241   260   279   297   316   334   1028   2514
0.4 Percent     170   188   207   224   243   262   281   300   320   337   1031   2531
-8.5 Percent    170   188   207   225   244  n.a.  n.a.  n.a.  n.a.  n.a.   1034   n.a.

                          Revenues (in billions of dollars)
                                                                          Total, Total,
Growth Rate    2003  2004  2005  2006  2007  2008  2009  2010  2011  2012  03-07  03-12
-------------  ----  ----  ----  ----  ----  ----  ----  ----  ----  ----  -----  -----
2002 Baseline  1962  2083  2244  2381  2513  2658  2809  2965  3243  3521  11184  26379
Inflation      1961  2075  2199  2315  2441  2581  2730  2881  3035  3204  10991  25422
GDP            1961  2075  2199  2315  2441  2581  2730  2881  3035  3204  10991  25422
8.5 Percent    1961  2075  2199  2315  2441  2581  2730  2881  3035  3204  10991  25422
0.4 Percent    1961  2075  2199  2315  2441  2581  2730  2881  3035  3204  10991  25422
-8.5 Percent   1961  2075  2199  2315  2441  n.a.  n.a.  n.a.  n.a.  n.a.  10991   n.a.

                    Discretionary Outlays (in billions  of dollars)
                                                                          Total, Total,
Growth Rate    2003  2004  2005  2006  2007  2008  2009  2010  2011  2012  03-07  03-12
-------------  ----  ----  ----  ----  ----  ----  ----  ----  ----  ----  -----  -----
2002 Baseline   782   803   827   845   864   889   912   936   965   983   4121   8807
Inflation       785   807   831   849   869   894   917   941   971   988   4141   8853
GDP             785   826   869   915   964  1016  1071  1127  1186  1248   4359  10008
8.5 Percent     785   834   900   967  1042  1130  1221  1321  1433  1542   4528  11174
0.4 Percent     785   799   809   811   813   821   825   830   839   836   4017   8168
-8.5 Percent    785   760   718   666   617  n.a.  n.a.  n.a.  n.a.  n.a.   3547   n.a.

                    Mandatory Outlays and Net Interest (in billions of dollars)
                                                                          Total, Total,
Growth Rate    2003  2004  2005  2006  2007  2008  2009  2010  2011  2012  03-07  03-12
-------------  ----  ----  ----  ----  ----  ----  ----  ----  ----  ----  -----  -----
2002 Baseline  1325  1391  1456  1522  1598  1680  1763  1851  1954  2016   7292  16557
Inflation      1325  1392  1459  1527  1608  1695  1784  1877  1990  2068   7311  16725
GDP            1325  1392  1461  1532  1617  1711  1808  1913  2038  2132   7328  16930
8.5 Percent    1325  1392  1462  1536  1625  1724  1829  1944  2083  2194   7340  17115
0.4 Percent    1325  1392  1457  1524  1602  1685  1769  1857  1961  2031   7301  16605
-8.5 Percent   1325  1391  1453  1513  1581  n.a.  n.a.  n.a.  n.a.  n.a.   7263   n.a.

Note: the above tables assume:
1) All Revenue Provisions Scheduled to Expire in the Next 10 Years are Extended
2) Discretionary Budget Authority Equals President's Request of $759 billion for
   2003 and Such Spending Grows at the the specified rate after 2003
Source: Congressional Budget Office, Letter to George V. Voinovich, online at
        ftp://ftp.cbo.gov/40xx/doc4004/12-04-VoinovichLetter.pdf

* Definitions of Various Deficits and Surpluses
  ---------------------------------------------
- Off-Budget Surplus consists of Social Security surplus plus net cash flow
  of Postal Service (which doesn't exceed $1 billion for the years shown).
- On-Budget Deficit or Surplus consists of all other deficits or surpluses,
  including surpluses run in other government accounts (chiefly Civil Service
  Retirement, Military Retirement, Medicare, and Unemployment Insurance).
- Total Deficit or Surplus equals Off-Budget plus On-Budget Deficit or Surplus.
- Public Deficit or Surplus is the change in the Public Debt.
- Gross Deficit or Surplus is the change in the Gross Federal Debt.

Surplus or Deficit (-) (estimated, at end of year)

Year           2003  2004  2005  2006  2007  2008  2009  2010  2011  2012
-------------  ----  ----  ----  ----  ----  ----  ----  ----  ----  ----
Total Deficit  -145  -111   -39    15    52    88   133   177   323   522
(Adjustment)    -27   -18   -18   -18   -16   -16   -15   -14   -14   -13
-------------  ----  ----  ----  ----  ----  ----  ----  ----  ----  ----
Public Deficit -172  -129   -57    -3    36    72   118   163   309   509
Soc. Security  -171  -188  -206  -224  -242  -262  -280  -299  -319  -337
Other govt      -60   -95  -111  -123  -129  -134  -137  -142  -148  -160
-------------  ----  ----  ----  ----  ----  ----  ----  ----  ----  ----
Gross Deficit  -403  -412 -374   -349  -336  -323  -300  -279  -157    13

Source: Congressional Budget Office, Budget and Ecomomic Outlook, August 2002,
        online at http://www.cbo.gov/showdoc.cfm?index=3735&sequence=2
Go to Budget Home Page


