ASSUMPTIONS UNDERLYING CBO'S LONG-TERM BUDGET SCENARIOS
Spending Revenues
------------ --------
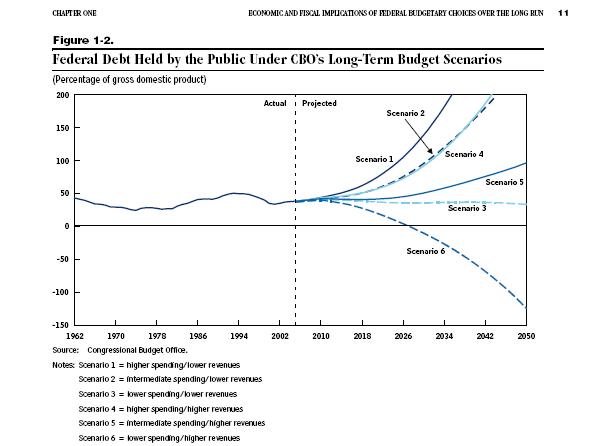
Scenario 1: Higher Lower
Scenario 2: Intermediate Lower
Scenario 3: Lower Lower
Scenario 4: Higher Higher
Scenario 5: Intermediate Higher
Scenario 6: Lower Higher
Intermediate
Program Higher Spending Spending Lower Spending
--------------- ------------------- ------------------- -------------------
Social Security Benefits paid as Benefits paid as Benefits paid as
scheduled under scheduled under scheduled under
current law current law current law
Medicare Excess cost growth Excess cost growth No excess cost
of 2.5 percentage of 1.0 percentage growth
points point
Medicaid Excess cost growth Excess cost growth No excess cost
of 2.5 percentage of 1.0 percentage growth
points point
Other Mandatory Stabilize at the Stabilize at the Decline by 1 percent
Programs* 2005 level as a 2005 level as a annually as a
percentage of GDP percentage of GDP percentage of GDP
Defense Follow FYDP through Phase down to $406 Phase down to $406
Programs 2024, then grow at billion (in 2005 billion (in 2005
rate of CPI dollars) in 2024 dollars) in 2024
and then grow at and then grow at
rate of CPI rate of CPI
Nondefense Phase down to Phase down to Grow at rate of CPI
Discretionary historical share of historical share of after 2007
Programs GDP (3.6 percent) GDP (3.6 percent)
by 2007 and remain by 2007 and remain
there there
Revenue Source Lower Revenues Higher Revenues
----------------- ------------------------------ --------------------------
Individual Income Gradually rise as a percentage Follow current law
Tax of GDP until 2014, then
adjusted so total federal
revenues equal 18.3 percent
of GDP
Social Insurance Follow current law Follow current law
(Payroll) Taxes
Other Taxes Remain fixed at 2014 level Remain fixed at 2014 level
as a percentage of GDP as a percentage of GDP
* excludes premiums paid by Medicare beneficiaries
Note: FYDP = Future Years Defense Program
Source: The Long-Term Budget Outlook, December 2005, Figure 1-2 on page 11,
Table A-1 on page 48, Congressional Budget Office