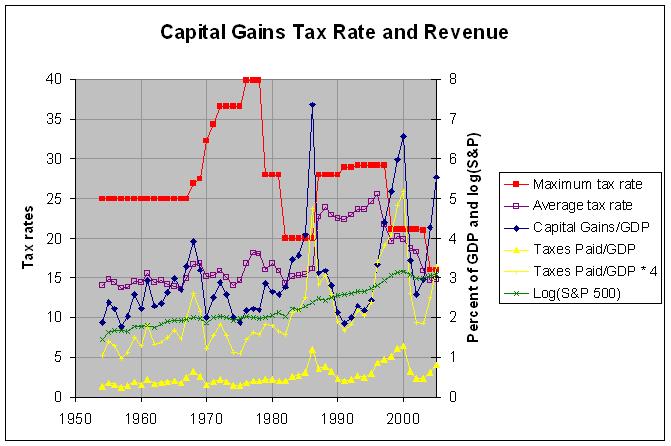
                   Capital Gains and Taxes Paid on Capital Gains
               for Returns with Positive Net Capital Gains, 1954-2005
                            (dollar amounts in billions)

         Total     Taxes  Realized     Taxes   Maximum                        Common
      Realized   Paid on  Gains as   Paid as   Rate on   Average              Log of     Gross
       Capital   Capital   Percent   Percent Long-Term Effective  Mid-year  Mid-year  Domestic
Year     Gains     Gains    of GDP    of GDP     Gains  Tax Rate   S&P 500   S&P 500   Product
----  --------  --------  --------  --------  --------  --------  --------  --------  --------
1954     7.157     1.010      1.88     0.266     25.00      14.1     29.21     1.466     380.4
1955     9.881     1.465      2.38     0.353     25.00      14.8     41.19     1.615     414.8
1956     9.683     1.402      2.21     0.320     25.00      14.5     46.93     1.671     437.5
1957     8.110     1.115      1.76     0.242     25.00      13.7     47.43     1.676     461.1
1958     9.440     1.309      2.02     0.280     25.00      13.9     45.28     1.656     467.2
1959    13.137     1.920      2.59     0.379     25.00      14.6     58.97     1.771     506.6
1960    11.747     1.687      2.23     0.320     25.00      14.4     57.06     1.756     526.4
1961    16.001     2.481      2.93     0.455     25.00      15.5     65.21     1.814     544.7
1962    13.451     1.954      2.29     0.334     25.00      14.5     54.75     1.738     585.6
1963    14.579     2.143      2.36     0.347     25.00      14.7     69.37     1.841     617.7
1964    17.431     2.482      2.62     0.374     25.00      14.2     81.69     1.912     663.6
1965    21.484     3.003      2.98     0.418     25.00      14.0     84.12     1.925     719.1
1966    21.348     2.905      2.70     0.369     25.00      13.6     84.74     1.928     787.8
1967    27.535     4.112      3.30     0.494     25.00      14.9     90.64     1.957     832.6
1968    35.607     5.943      3.91     0.653     26.90      16.7     99.58     1.998     910.0
1969    31.439     5.275      3.19     0.536     27.50      16.8     97.71     1.990     984.6
1970    20.848     3.161      2.01     0.304     32.21      15.2     72.72     1.862    1038.5
1971    28.341     4.350      2.51     0.386     34.25      15.3     99.16     1.996    1127.1
1972    35.869     5.708      2.89     0.461     36.50      15.9    107.14     2.030    1238.3
1973    35.757     5.366      2.58     0.388     36.50      15.0    104.10     2.017    1382.7
1974    30.217     4.253      2.01     0.284     36.50      14.1     86.00     1.934    1500.0
1975    30.903     4.534      1.89     0.277     36.50      14.7     95.19     1.979    1638.3
1976    39.492     6.621      2.17     0.363    39.875      16.8    104.28     2.018    1825.3
1977    45.338     8.232      2.23     0.405    39.875      18.2    100.48     2.002    2030.9
1978    50.526     9.104      2.20     0.397    39.875      18.0     95.53     1.980    2294.7
1979    73.443    11.753      2.86     0.459     28.00      16.0    102.91     2.012    2563.3
1980    74.132    12.459      2.65     0.447     28.00      16.8    114.24     2.058    2789.5
1981    80.938    12.852      2.58     0.411     28.00      15.9    131.21     2.118    3128.4
1982    90.153    12.900      2.77     0.396     20.00      14.3    109.52     2.039    3255.0
1983   122.773    18.700      3.47     0.529     20.00      15.2    168.11     2.226    3536.7
1984   140.500    21.453      3.57     0.545     20.00      15.3    153.16     2.185    3933.2
1985   171.985    26.460      4.08     0.627     20.00      15.4    191.85     2.283    4220.3
1986   327.725    52.914      7.36     1.186     20.00      16.1    250.67     2.399    4462.8
1987   148.449    33.714      3.13     0.711     28.00      22.7    303.99     2.483    4739.5
1988   162.592    38.866      3.18     0.762     28.00      23.9    273.50     2.437    5103.8
1989   154.040    35.258      2.81     0.643     28.00      22.9    317.98     2.502    5484.4
1990   123.783    27.829      2.13     0.480     28.00      22.5    358.02     2.554    5803.1
1991   111.592    24.903      1.86     0.415     28.93      22.3    371.18     2.570    5995.9
1992   126.692    28.983      2.00     0.457     28.93      22.9    408.20     2.611    6337.7
1993   152.259    36.112      2.29     0.542     29.19      23.7    450.54     2.654    6657.4
1994   152.727    36.243      2.17     0.512     29.19      23.7    444.27     2.648    7072.2
1995   180.130    44.254      2.43     0.598     29.19      24.6    544.75     2.736    7397.7
1996   260.696    66.396      3.34     0.849     29.19      25.5    670.63     2.826    7816.9
1997   364.829    79.305      4.39     0.955     29.19      21.7    885.14     2.947    8304.3
1998   455.223    89.069      5.18     1.018     21.19      19.6   1133.84     3.055    8747.0
1999   552.608   111.821      5.96     1.206     21.19      20.2   1372.71     3.138    9268.4
2000   644.285   127.297      6.56     1.297     21.19      19.8   1454.60     3.163    9817.0
2001   349.441    65.668      3.45     0.648     21.17      18.8   1224.42     3.088   10128.0
2002   268.615    49.122      2.57     0.469     21.16      18.3    989.82     2.996   10469.6
2003   323.306    51.340      2.95     0.468     21.05      15.9    974.50     2.989   10960.8
2004   499.154    73.213      4.27     0.627     16.05      14.7   1140.84     3.057   11685.9
2005   690.152   102.174      5.55     0.822     16.05      14.8   1191.33     3.076   12433.9

Source: Department of the Treasury, Office of Tax Analysis; Yahoo! Finance;
        Budget of the U.S. Government, FY 2009: Historical Tables, table 10.1
Go to Related blog entry
Go to Budget Home Page
