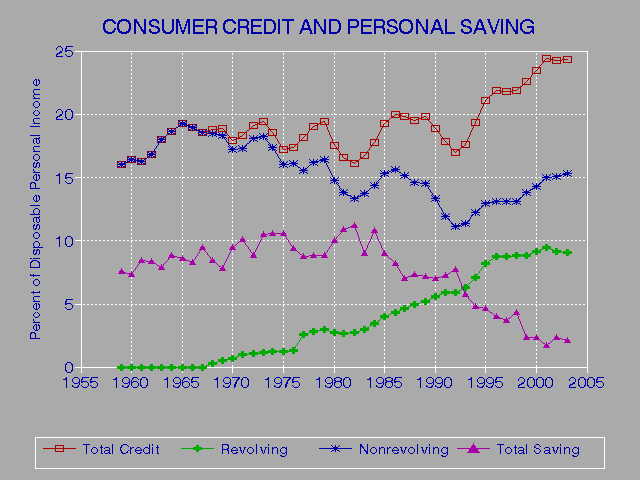
      OUTSTANDING CONSUMER CREDIT AND PERSONAL SAVING: 1959-2003
                         (billions of dollars)

              Personal Disposable    Total                Non-
     Personal  Current   Personal Consumer Revolving Revolving Personal
Year   Income    Taxes     Income   Credit    Credit    Credit   Saving
-----------------------------------------------------------------------
1959    392.8     42.3      350.5     56.0       0.0      56.0     26.7
1960    411.5     46.1      365.4     60.0       0.0      60.0     26.7
1961    429.0     47.3      381.8     62.2       0.0      62.2     32.2
1962    456.7     51.6      405.1     68.1       0.0      68.1     33.8
1963    479.6     54.6      425.1     76.6       0.0      76.6     33.3
1964    514.6     52.1      462.5     86.0       0.0      86.0     40.8
1965    555.7     57.7      498.1     96.0       0.0      96.0     43.0
1966    603.9     66.4      537.5    101.8       0.0     101.8     44.4
1967    648.3     73.0      575.3    106.8       0.0     106.8     54.4
1968    712.0     87.0      625.0    117.4       2.0     115.4     52.8
1969    778.5    104.5      674.0    127.2       3.6     123.6     52.5
1970    838.8    103.1      735.7    131.6       5.0     126.6     69.5
1971    903.5    101.7      801.8    146.9       8.2     138.7     80.6
1972    992.7    123.6      869.1    166.2       9.4     156.8     77.2
1973   1110.7    132.4      978.3    190.1      11.3     178.7    102.7
1974   1222.6    151.0     1071.6    198.9      13.2     185.7    113.6
1975   1335.0    147.6     1187.4    204.0      14.5     189.5    125.6
1976   1474.8    172.3     1302.5    225.7      16.5     209.2    122.3
1977   1633.2    197.5     1435.7    260.6      37.4     223.1    125.3
1978   1837.7    229.4     1608.3    306.1      45.7     260.4    142.5
1979   2062.2    268.7     1793.5    348.6      53.6     295.0    159.1
1980   2307.9    298.9     2009.0    351.9      55.0     297.0    201.4
1981   2591.3    345.2     2246.1    371.3      60.9     310.4    244.3
1982   2775.3    354.1     2421.2    389.8      66.3     323.5    270.8
1983   2960.7    352.3     2608.4    437.1      79.0     358.0    233.6
1984   3289.5    377.4     2912.0    517.3     100.4     416.9    314.8
1985   3526.7    417.4     3109.3    599.7     124.5     475.2    280.0
1986   3722.4    437.3     3285.1    654.8     141.1     513.7    268.4
1987   3947.4    489.1     3458.3    686.3     160.9     525.5    241.4
1988   4253.7    505.0     3748.7    731.9     184.6     547.3    272.9
1989   4587.8    566.1     4021.7    794.6     211.2     583.4    287.1
1990   4878.6    592.8     4285.8    808.2     238.6     569.6    299.4
1991   5051.0    586.7     4464.3    798.0     263.8     534.3    324.2
1992   5362.0    610.6     4751.4    806.1     278.4     527.7    366.0
1993   5558.5    646.6     4911.9    865.7     309.9     555.7    284.0
1994   5842.5    690.7     5151.8    997.1     365.6     631.6    249.5
1995   6152.3    744.1     5408.2   1140.6     443.1     697.5    250.9
1996   6520.6    832.1     5688.5   1242.2     498.9     743.2    228.4
1997   6915.1    926.3     5988.8   1305.0     521.7     783.4    218.3
1998   7423.0   1027.0     6395.9   1400.3     562.8     837.5    276.8
1999   7802.4   1107.5     6695.0   1512.8     590.5     922.3    158.6
2000   8429.7   1235.7     7194.0   1686.2     658.9    1027.4    168.5
2001   8713.1   1243.7     7469.4   1822.2     703.9    1118.3    127.2
2002   8910.3   1053.1     7857.2   1902.7     716.7    1186.0    183.2
2003   9208.0    991.4     8216.5   1998.5     744.9    1253.6    173.5

========================================================================
      OUTSTANDING CONSUMER CREDIT AND PERSONAL SAVING: 1959-2003

      Percent of Personal Income   Percent of Disposable Personal Income
     ----------------------------- -------------------------------------
               Personal Disposable    Total                Non-
     Personal   Current   Personal Consumer Revolving Revolving Personal
Year   Income     Taxes     Income   Credit    Credit    Credit   Saving
---- ----------------------------- -------------------------------------
1959   100.00     10.77      89.23    15.98      0.00     15.98     7.62
1960   100.00     11.20      88.80    16.43      0.00     16.43     7.31
1961   100.00     11.03      89.00    16.30      0.00     16.30     8.43
1962   100.00     11.30      88.70    16.82      0.00     16.82     8.34
1963   100.00     11.38      88.64    18.01      0.00     18.01     7.83
1964   100.00     10.12      89.88    18.59      0.00     18.59     8.82
1965   100.00     10.38      89.63    19.26      0.00     19.26     8.63
1966   100.00     11.00      89.00    18.94      0.00     18.94     8.26
1967   100.00     11.26      88.74    18.57      0.00     18.57     9.46
1968   100.00     12.22      87.78    18.78      0.33     18.46     8.45
1969   100.00     13.42      86.58    18.87      0.53     18.33     7.79
1970   100.00     12.29      87.71    17.88      0.67     17.21     9.45
1971   100.00     11.26      88.74    18.33      1.03     17.30    10.05
1972   100.00     12.45      87.55    19.12      1.08     18.04     8.88
1973   100.00     11.92      88.08    19.43      1.16     18.27    10.50
1974   100.00     12.35      87.65    18.56      1.24     17.33    10.60
1975   100.00     11.06      88.94    17.18      1.22     15.96    10.58
1976   100.00     11.68      88.32    17.33      1.27     16.06     9.39
1977   100.00     12.09      87.91    18.15      2.61     15.54     8.73
1978   100.00     12.48      87.52    19.03      2.84     16.19     8.86
1979   100.00     13.03      86.97    19.44      2.99     16.45     8.87
1980   100.00     12.95      87.05    17.52      2.74     14.78    10.02
1981   100.00     13.32      86.68    16.53      2.71     13.82    10.88
1982   100.00     12.76      87.24    16.10      2.74     13.36    11.18
1983   100.00     11.90      88.10    16.76      3.03     13.73     8.96
1984   100.00     11.47      88.52    17.76      3.45     14.32    10.81
1985   100.00     11.84      88.16    19.29      4.00     15.28     9.01
1986   100.00     11.75      88.25    19.93      4.29     15.64     8.17
1987   100.00     12.39      87.61    19.85      4.65     15.19     6.98
1988   100.00     11.87      88.13    19.52      4.92     14.60     7.28
1989   100.00     12.34      87.66    19.76      5.25     14.51     7.14
1990   100.00     12.15      87.85    18.86      5.57     13.29     6.99
1991   100.00     11.62      88.38    17.88      5.91     11.97     7.26
1992   100.00     11.39      88.61    16.97      5.86     11.11     7.70
1993   100.00     11.63      88.37    17.62      6.31     11.31     5.78
1994   100.00     11.82      88.18    19.35      7.10     12.26     4.84
1995   100.00     12.09      87.91    21.09      8.19     12.90     4.64
1996   100.00     12.76      87.24    21.84      8.77     13.07     4.02
1997   100.00     13.40      86.60    21.79      8.71     13.08     3.65
1998   100.00     13.84      86.16    21.89      8.80     13.09     4.33
1999   100.00     14.19      85.81    22.60      8.82     13.78     2.37
2000   100.00     14.66      85.34    23.44      9.16     14.28     2.34
2001   100.00     14.27      85.73    24.40      9.42     14.97     1.70
2002   100.00     11.82      88.18    24.22      9.12     15.09     2.33
2003   100.00     10.77      89.23    24.32      9.07     15.26     2.11
------------------------------------------------------------------------
Source: Economic Report of the President, 2004, Tables B-30 and B-77;
        Federal Reserve, Consumer Credit Historical Data, Seasonally adjusted;
        Bureau of Economic Analysis, National Income and Product Accounts Table 2.1
Note: Consumer credit covers most short- and intermediate-term credit
      extended to individuals, excluding credit secured by real estate;
      Nonrevolving credit includes loans (secured or unsecured) for mobile
      homes, education, boats, trailers, vacations and other purposes;
      All credit amounts are from December of the specified year;
Go to Budget Home Page
