RECEIPTS, OUTLAYS, AND SURPLUSES OR DEFICITS(-): 1940-2013
(billions of dollars)
Public
Total Total Unified Public Def w/o Gross OASDI Medicare
Year Receipts Outlays Deficit Deficit OASDI Deficit Surplus Surplus GDP
---- -------- ------- ------- ------- ------- ------- ------- ------- -------
1940 6.5 9.5 -2.9 0.6 96.8
1941 8.7 13.7 -4.9 -5.5 -6.1 -6.8 0.7 114.1
1942 14.6 35.1 -20.5 -19.5 -20.4 -21.7 0.8 144.3
1943 24.0 78.6 -54.6 -60.0 -61.1 -63.4 1.0 180.3
1944 43.7 91.3 -47.6 -57.0 -58.2 -61.4 1.2 209.2
1945 45.2 92.7 -47.6 -50.4 -51.6 -56.0 1.2 221.4
1946 39.3 55.2 -15.9 -6.7 -7.7 -10.9 1.0 222.7
1947 38.5 34.5 4.0 17.5 16.4 13.8 1.2 233.2
1948 41.6 29.8 11.8 8.1 6.8 5.1 1.2 256.0
1949 39.4 38.8 0.6 1.9 0.7 -0.6 1.3 271.1
1950 39.4 42.6 -3.1 -4.7 -6.3 -4.2 1.6 273.0
1951 51.6 45.5 6.1 4.7 2.9 1.6 1.8 320.6
1952 66.2 67.7 -1.5 -0.4 -2.3 -3.8 1.9 348.6
1953 69.6 76.1 -6.5 -3.6 -5.4 -6.9 1.8 372.9
1954 69.7 70.9 -1.2 -6.1 -7.8 -4.8 1.7 377.3
1955 65.5 68.4 -3.0 -2.1 -3.2 -3.6 1.1 394.6
1956 74.6 70.6 3.9 4.5 3.0 1.7 1.5 427.2
1957 80.0 76.6 3.4 2.8 2.1 0.4 0.8 450.3
1958 79.6 82.4 -2.8 -7.0 -7.6 -7.4 0.5 460.5
1959 79.2 92.1 -12.8 -8.4 -7.7 -7.8 -0.7 491.5
1960 92.5 92.2 0.3 -2.1 -1.9 -3.1 -0.2 517.9
1961 94.4 97.7 -3.3 -1.5 -1.9 -2.1 0.4 530.8
1962 99.7 106.8 -7.1 -9.7 -8.4 -10.3 -1.3 567.6
1963 106.6 111.3 -4.8 -6.0 -5.2 -7.4 -0.8 598.7
1964 112.6 118.5 -5.9 -2.9 -3.5 -5.7 0.6 640.4
1965 116.8 118.2 -1.4 -3.9 -4.1 -6.3 0.2 0.0 687.1
1966 130.8 134.5 -3.7 -2.9 -2.3 -6.2 -0.6 0.9 752.9
1967 148.8 157.5 -8.6 -2.9 -6.9 -11.9 4.0 1.0 811.8
1968 153.0 178.1 -25.2 -22.9 -25.5 -28.2 2.6 -0.1 866.6
1969 186.9 183.6 3.2 11.4 7.7 2.9 3.7 0.7 948.6
1970 192.8 195.6 -2.8 -5.1 -10.9 -15.2 5.9 0.3 1012.2
1971 187.1 210.2 -23.0 -19.8 -22.9 -27.3 3.0 0.7 1079.9
1972 207.3 230.7 -23.4 -19.3 -22.4 -27.8 3.1 -0.1 1178.3
1973 230.8 245.7 -14.9 -18.5 -19.0 -30.4 0.5 1.8 1307.6
1974 263.2 269.4 -6.1 -2.8 -4.6 -17.6 1.8 4.1 1439.3
1975 279.1 332.3 -53.2 -51.0 -53.0 -58.0 2.0 2.1 1560.7
1976 298.1 371.8 -73.7 -82.7 -79.5 -87.0 -3.2 0.7 1736.5
1977 355.6 409.2 -53.7 -71.7 -66.4 -77.4 -3.9 1.2 1974.3
1978 399.6 458.7 -59.2 -58.0 -53.8 -70.2 -4.3 2.4 2217.0
1979 463.3 504.0 -40.7 -33.2 -31.2 -52.9 -2.0 2.6 2500.7
1980 517.1 590.9 -73.8 -71.6 -70.5 -79.6 -1.1 0.7 2726.7
1981 599.3 678.2 -79.0 -77.5 -72.5 -85.8 -5.0 2.8 3054.7
1982 617.8 745.7 -128.0 -135.2 -127.2 -142.5 -7.9 4.8 3227.6
1983 600.6 808.4 -207.8 -212.7 -225.3 -234.3 0.2 6.2 3440.7
1984 666.5 851.9 -185.4 -169.7 -170.0 -192.9 0.3 5.6 3840.2
1985 734.1 946.4 -212.3 -200.3 -207.8 -252.8 9.4 4.1 4141.5
1986 769.2 990.4 -221.2 -233.4 -239.5 -303.1 16.7 5.5 4412.4
1987 854.4 1004.1 -149.7 -149.1 -168.7 -225.5 19.6 8.9 4647.1
1988 909.3 1064.5 -155.2 -161.9 -200.7 -255.1 38.8 15.3 5008.6
1989 991.2 1143.8 -152.6 -139.1 -191.5 -266.7 52.4 22.4 5400.5
1990 1032.1 1253.1 -221.0 -220.8 -279.1 -338.5 58.2 15.5 5735.4
1991 1055.1 1324.3 -269.2 -277.4 -331.0 -391.9 53.5 15.4 5935.1
1992 1091.3 1381.6 -290.3 -310.7 -361.5 -403.6 50.7 13.6 6239.9
1993 1154.5 1409.5 -255.1 -248.7 -295.4 -349.3 46.8 10.2 6575.5
1994 1258.7 1461.9 -203.2 -184.7 -241.4 -292.3 56.8 1.1 6961.3
1995 1351.9 1515.9 -164.0 -171.3 -231.8 -277.3 60.4 -7.1 7325.8
1996 1453.2 1560.6 -107.4 -129.7 -196.1 -260.9 66.4 8.9 7694.1
1997 1579.4 1601.3 -21.9 -38.3 -119.6 -187.7 81.3 -1.1 8182.4
1998 1722.0 1652.7 69.3 51.2 -48.2 -109.0 99.4 6.6 8627.9
1999 1827.6 1702.0 125.6 88.7 -36.0 -127.3 124.7 26.3 9125.3
2000 2025.5 1789.2 236.2 222.6 70.7 -23.2 151.8 29.9 9709.8
2001 1991.4 1863.2 128.2 90.2 -72.8 -141.2 163.0 25.2 10057.9
2002 1853.4 2011.2 -157.8 -220.8 -379.9 -428.5 159.1 28.6 10377.4
2003 1782.5 2160.1 -377.6 -373.0 -528.7 -561.6 155.7 8.1 10808.6
2004 1880.3 2293.0 -412.7 -382.1 -533.0 -594.6 150.9 6.1 11499.9
2005 2153.9 2472.2 -318.3 -296.7 -470.2 -550.6 173.5 12.5 12237.9
2006 2407.3 2655.4 -248.2 -236.8 -422.0 -546.1 185.2 41.8 13015.5
2007 2568.2 2730.2 -162.0 -206.2 -392.8 -499.4 186.6 22.1 13667.5
2008* 2521.2 2931.2 -410.0 -393.5 -586.6 -703.7 193.1 17.8 14311.5
2009* 2699.9 3107.4 -407.4 -427.5 -632.3 -759.0 204.8 17.8 15027.0
2010* 2931.3 3091.3 -160.0 -174.9 -399.7 -541.0 224.8 22.2 15792.0
2011* 3076.4 3171.2 -94.8 -108.6 -349.7 -502.1 241.1 21.6 16580.2
2012* 3269.9 3221.8 48.1 30.2 -220.9 -411.7 251.1 50.8 17395.0
2013* 3428.2 3398.9 29.3 12.1 -217.8 -408.3 229.9 45.2 18243.3
RECEIPTS, OUTLAYS, AND SURPLUSES OR DEFICITS(-) FROM PRIOR BUDGET: 2007-2012
(billions of dollars)
Public
Total Total Unified Public Def w/o Gross OASDI Medicare
Year Receipts Outlays Deficit Deficit OASDI Deficit Surplus Surplus GDP
---- -------- ------- ------- ------- ------- ------- ------- ------- -------
2007* 2540.1 2784.3 -244.2 -254.3 -439.8 -556.4 185.5 21.4 13761.2
2008* 2662.5 2901.9 -239.4 -262.2 -471.4 -567.7 209.3 29.1 14515.0
2009* 2798.3 2985.5 -187.2 -208.2 -435.6 -562.8 227.4 27.5 15306.4
2010* 2954.7 3049.1 -94.4 -117.5 -363.8 -499.3 246.2 31.0 16112.4
2011* 3103.6 3157.3 -53.8 -77.1 -343.5 -477.2 266.4 23.0 16937.8
2012* 3307.3 3246.3 61.0 37.2 -212.0 -372.5 249.2 46.3 17786.0
CHANGE IN RECEIPTS, OUTLAYS, AND SURPLUSES OR DEFICITS(-) FROM PRIOR BUDGET: 2007-2012
(billions of dollars)
Public
Total Total Unified Public Def w/o Gross OASDI Medicare
Year Receipts Outlays Deficit Deficit OASDI Deficit Surplus Surplus GDP
---- -------- ------- ------- ------- ------- ------- ------- ------- -------
2007 28.1 -54.1 82.2 48.1 47.0 57.0 1.1 0.7 -93.7
2008 -141.3 29.3 -170.6 -131.3 -115.2 -136.0 -16.2 -11.3 -203.5
2009 -98.4 121.9 -220.2 -219.3 -196.7 -196.2 -22.6 -9.7 -279.4
2010 -23.4 42.2 -65.6 -57.4 -35.9 -41.7 -21.4 -8.8 -320.4
2011 -27.2 13.9 -41.0 -31.5 -6.2 -24.9 -25.3 -1.4 -357.6
2012 -37.4 -24.5 -13.0 -7.0 -8.9 -39.2 1.9 4.5 -391.0
-------------------------------------------------------------------------------------
RECEIPTS, OUTLAYS, AND SURPLUSES OR DEFICITS(-): 1940-2013
(percentage of GDP)
Public
Total Total Unified Public Def w/o Gross OASDI Medicare GDP
Year Receipts Outlays Deficit Deficit OASDI Deficit Surplus Surplus ($bil)
---- -------- -------- -------- -------- -------- -------- -------- -------- --------
1940 6.8 9.8 -3.0 0.6 96.8
1940 6.8 9.8 -3.0 0.6 96.8
1941 7.6 12.0 -4.3 -4.8 -5.3 -6.0 0.6 114.1
1942 10.1 24.3 -14.2 -13.5 -14.1 -15.0 0.6 144.3
1943 13.3 43.6 -30.3 -33.3 -33.9 -35.2 0.6 180.3
1944 20.9 43.6 -22.7 -27.3 -27.8 -29.4 0.6 209.2
1945 20.4 41.9 -21.5 -22.8 -23.3 -25.3 0.5 221.4
1946 17.6 24.8 -7.2 -3.0 -3.5 -4.9 0.5 222.7
1947 16.5 14.8 1.7 7.5 7.0 5.9 0.5 233.2
1948 16.2 11.6 4.6 3.2 2.7 2.0 0.5 256.0
1949 14.5 14.3 0.2 0.7 0.3 -0.2 0.5 271.1
1950 14.4 15.6 -1.1 -1.7 -2.3 -1.6 0.6 273.0
1951 16.1 14.2 1.9 1.5 0.9 0.5 0.6 320.6
1952 19.0 19.4 -0.4 -0.1 -0.7 -1.1 0.5 348.6
1953 18.7 20.4 -1.7 -1.0 -1.4 -1.8 0.5 372.9
1954 18.5 18.8 -0.3 -1.6 -2.1 -1.3 0.4 377.3
1955 16.6 17.3 -0.8 -0.5 -0.8 -0.9 0.3 394.6
1956 17.5 16.5 0.9 1.0 0.7 0.4 0.3 427.2
1957 17.8 17.0 0.8 0.6 0.5 0.1 0.2 450.3
1958 17.3 17.9 -0.6 -1.5 -1.6 -1.6 0.1 460.5
1959 16.1 18.7 -2.6 -1.7 -1.6 -1.6 -0.1 491.5
1960 17.9 17.8 0.1 -0.4 -0.4 -0.6 0.0 517.9
1961 17.8 18.4 -0.6 -0.3 -0.4 -0.4 0.1 530.8
1962 17.6 18.8 -1.3 -1.7 -1.5 -1.8 -0.2 567.6
1963 17.8 18.6 -0.8 -1.0 -0.9 -1.2 -0.1 598.7
1964 17.6 18.5 -0.9 -0.4 -0.5 -0.9 0.1 640.4
1965 17.0 17.2 -0.2 -0.6 -0.6 -0.9 0.0 0.0 687.1
1966 17.4 17.9 -0.5 -0.4 -0.3 -0.8 -0.1 0.1 752.9
1967 18.3 19.4 -1.1 -0.4 -0.8 -1.5 0.5 0.1 811.8
1968 17.7 20.6 -2.9 -2.6 -2.9 -3.3 0.3 0.0 866.6
1969 19.7 19.4 0.3 1.2 0.8 0.3 0.4 0.1 948.6
1970 19.0 19.3 -0.3 -0.5 -1.1 -1.5 0.6 0.0 1012.2
1971 17.3 19.5 -2.1 -1.8 -2.1 -2.5 0.3 0.1 1079.9
1972 17.6 19.6 -2.0 -1.6 -1.9 -2.4 0.3 0.0 1178.3
1973 17.7 18.8 -1.1 -1.4 -1.5 -2.3 0.0 0.1 1307.6
1974 18.3 18.7 -0.4 -0.2 -0.3 -1.2 0.1 0.3 1439.3
1975 17.9 21.3 -3.4 -3.3 -3.4 -3.7 0.1 0.1 1560.7
1976 17.2 21.4 -4.2 -4.8 -4.6 -5.0 -0.2 0.0 1736.5
1977 18.0 20.7 -2.7 -3.6 -3.4 -3.9 -0.2 0.1 1974.3
1978 18.0 20.7 -2.7 -2.6 -2.4 -3.2 -0.2 0.1 2217.0
1979 18.5 20.2 -1.6 -1.3 -1.2 -2.1 -0.1 0.1 2500.7
1980 19.0 21.7 -2.7 -2.6 -2.6 -2.9 0.0 0.0 2726.7
1981 19.6 22.2 -2.6 -2.5 -2.4 -2.8 -0.2 0.1 3054.7
1982 19.1 23.1 -4.0 -4.2 -3.9 -4.4 -0.2 0.1 3227.6
1983 17.5 23.5 -6.0 -6.2 -6.5 -6.8 0.0 0.2 3440.7
1984 17.4 22.2 -4.8 -4.4 -4.4 -5.0 0.0 0.1 3840.2
1985 17.7 22.9 -5.1 -4.8 -5.0 -6.1 0.2 0.1 4141.5
1986 17.4 22.4 -5.0 -5.3 -5.4 -6.9 0.4 0.1 4412.4
1987 18.4 21.6 -3.2 -3.2 -3.6 -4.9 0.4 0.2 4647.1
1988 18.2 21.3 -3.1 -3.2 -4.0 -5.1 0.8 0.3 5008.6
1989 18.4 21.2 -2.8 -2.6 -3.5 -4.9 1.0 0.4 5400.5
1990 18.0 21.8 -3.9 -3.9 -4.9 -5.9 1.0 0.3 5735.4
1991 17.8 22.3 -4.5 -4.7 -5.6 -6.6 0.9 0.3 5935.1
1992 17.5 22.1 -4.7 -5.0 -5.8 -6.5 0.8 0.2 6239.9
1993 17.6 21.4 -3.9 -3.8 -4.5 -5.3 0.7 0.2 6575.5
1994 18.1 21.0 -2.9 -2.7 -3.5 -4.2 0.8 0.0 6961.3
1995 18.5 20.7 -2.2 -2.3 -3.2 -3.8 0.8 -0.1 7325.8
1996 18.9 20.3 -1.4 -1.7 -2.5 -3.4 0.9 0.1 7694.1
1997 19.3 19.6 -0.3 -0.5 -1.5 -2.3 1.0 0.0 8182.4
1998 20.0 19.2 0.8 0.6 -0.6 -1.3 1.2 0.1 8627.9
1999 20.0 18.7 1.4 1.0 -0.4 -1.4 1.4 0.3 9125.3
2000 20.9 18.4 2.4 2.3 0.7 -0.2 1.6 0.3 9709.8
2001 19.8 18.5 1.3 0.9 -0.7 -1.4 1.6 0.3 10057.9
2002 17.9 19.4 -1.5 -2.1 -3.7 -4.1 1.5 0.3 10377.4
2003 16.5 20.0 -3.5 -3.5 -4.9 -5.2 1.4 0.1 10808.6
2004 16.4 19.9 -3.6 -3.3 -4.6 -5.2 1.3 0.1 11499.9
2005 17.6 20.2 -2.6 -2.4 -3.8 -4.5 1.4 0.1 12237.9
2006 18.5 20.4 -1.9 -1.8 -3.2 -4.2 1.4 0.3 13015.5
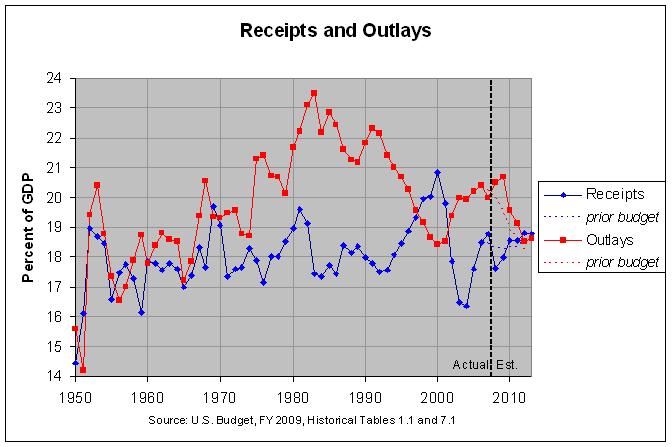
2007 18.8 20.0 -1.2 -1.5 -2.9 -3.7 1.4 0.2 13667.5
2008* 17.6 20.5 -2.9 -2.7 -4.1 -4.9 1.3 0.1 14311.5
2009* 18.0 20.7 -2.7 -2.8 -4.2 -5.1 1.4 0.1 15027.0
2010* 18.6 19.6 -1.0 -1.1 -2.5 -3.4 1.4 0.1 15792.0
2011* 18.6 19.1 -0.6 -0.7 -2.1 -3.0 1.5 0.1 16580.2
2012* 18.8 18.5 0.3 0.2 -1.3 -2.4 1.4 0.3 17395.0
2013* 18.8 18.6 0.2 0.1 -1.2 -2.2 1.3 0.2 18243.3
RECEIPTS, OUTLAYS, AND SURPLUSES OR DEFICITS(-) FROM PRIOR BUDGET: 2007-2012
(percentage of GDP)
Public
Total Total Unified Public Def w/o Gross OASDI Medicare
Year Receipts Outlays Deficit Deficit OASDI Deficit Surplus Surplus GDP
---- -------- -------- -------- -------- -------- -------- -------- -------- --------
2007* 18.5 20.2 -1.8 -1.8 -3.2 -4.0 1.3 0.2 13761.2
2008* 18.3 20.0 -1.6 -1.8 -3.2 -3.9 1.4 0.2 14515.0
2009* 18.3 19.5 -1.2 -1.4 -2.8 -3.7 1.5 0.2 15306.4
2010* 18.3 18.9 -0.6 -0.7 -2.3 -3.1 1.5 0.2 16112.4
2011* 18.3 18.6 -0.3 -0.5 -2.0 -2.8 1.6 0.1 16937.8
2012* 18.6 18.3 0.3 0.2 -1.2 -2.1 1.4 0.3 17786.0
CHANGE IN RECEIPTS, OUTLAYS, AND SURPLUSES OR DEFICITS(-) FROM PRIOR BUDGET: 2007-2012
(percentage of GDP)
Public
Total Total Unified Public Def w/o Gross OASDI Medicare
Year Receipts Outlays Deficit Deficit OASDI Deficit Surplus Surplus GDP
---- -------- -------- -------- -------- -------- -------- -------- -------- --------
2007 0.3 -0.3 0.6 0.3 0.3 0.4 0.0 0.0 -93.7
2008 -0.7 0.5 -1.2 -0.9 -0.9 -1.0 -0.1 -0.1 -203.5
2009 -0.3 1.2 -1.5 -1.5 -1.4 -1.4 -0.1 -0.1 -279.4
2010 0.2 0.7 -0.4 -0.4 -0.3 -0.3 -0.1 -0.1 -320.4
2011 0.2 0.5 -0.3 -0.2 -0.1 -0.2 -0.1 0.0 -357.6
2012 0.2 0.3 -0.1 0.0 -0.1 -0.3 0.0 0.0 -391.0
* estimated
Note: Public Deficit equals change in Public Debt; Gross Deficit equals change in
Gross Debt; Gross Debt equals debt held by the public (called Public Debt
here) plus debt held by government accounts; OASDI includes Old-Age and
Survivors Insurance Fund (OAS) and Disability Insurance Fund (DI);
negative numbers denote deficits
Source: Budget of the United States Government, FY 2009: Historical Tables,
tables 1.1, 7.1, 13.1
================================================================================
Among the points that the above tables illustrate are the following:
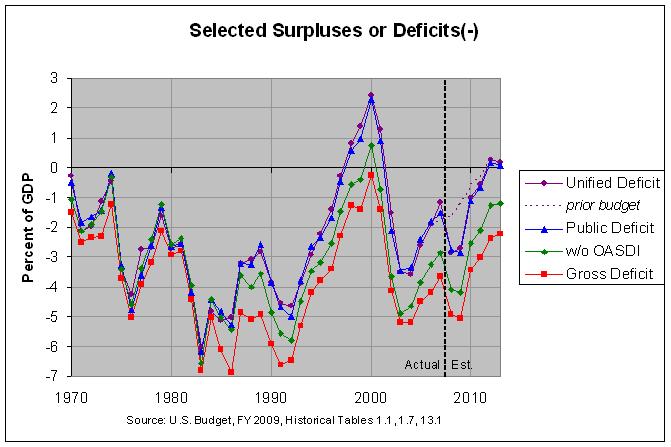
1) The gross deficit surpassed a half-trillion dollars per year for 2003
through 2006 and fell just short of that in 2007, reaching $499.4
billion. It is projected to rise sharply, surpassing $700 billion
per year in 2008 and 2009 and falling back to over $500 billion per
year in 2010 and 2011.
2) The unified deficit for 2007 is $82 billion less than was projected
in the prior budget but the outlook for the next two years has
greatly worsened. The prior budget projected that the deficit would
gradually decline, reaching a small surplus of $61 billion in 2012.
It is now projected to worsen by over $200 billion per year for the
next two years and then decline rapidly, still reaching a small
surplus (of $48 billion) in 2012. However, due to the high deficits
of the next two years, the gross federal debt is projected to be
$381 billion greater in 2012 than was projected in the prior budget.
Note: The unified deficit is the deficit that is most often reported
and, as the above graph shows, is very nearly equal to the public
deficit.
3) The sharp increase in the projected deficit over the next two years
is due to a sharp drop in revenues and an increase in spending.
Revenues are projected to drop from 18.8% of GDP in 2007 to an
average of 17.8% of GDP for the next two years and spending is
projected to increase from 20.0% of GDP in 2007 to an average of
20.6% of GDP for the next two years.
4) The sharp decrease in the projected deficit after 2009 is due to a
sharp drop in spending and an increase in revenues. Revenues are
projected to return to their 2007 level of 18.8% of GDP by 2012 and
spending is projected to drop to 18.5% of GDP from 20.0% by 2012.
This will be the lowest level of spending since 2001.
The following points show the relationship between deficits and their
corresponding debts. This is important since it is the debt that we
are paying interest on and are obligated to pay back. The figures
for the debts can be found at debt09.html.
5) The gross debt was at 65.5 percent of GDP at the end of 2007. In
order to stabilize at that level, the gross deficit would need to
stabilize at about 65.5 percent of the projected GDP growth rate.
As GDP is projected to grow at about 5 percent per year for the
next six years, this would be a level of about 3.3 percent of GDP.
Because the gross deficit is projected to be above this level for
the next 3 years, the gross debt is projected to rise modestly,
peaking at 69.4 percent of GDP in 2010.
6) The public debt was at 36.8 percent of GDP at the end of 2007. In
order to stabilize at that level, the public deficit would need to
stabilize at about 36.8 percent of the projected GDP growth rate.
As GDP is projected to grow at about 5 percent per year for the
next six years, this would be a level of about 1.8 percent of GDP.
Because the public deficit is projected to be above this level for
the next 2 years, the public debt is projected to rise modestly,
peaking at 39.0 percent of GDP in 2009.
================================================================================
DEBT HELD BY GOVERNMENT ACCOUNTS (billions of dollars)
Investment or disinvestment Holdings
------------------------------ end of
2007 % of 2008 2009 2009 % of
Description actual total est. est. est. total
---------------------------------- ------ ----- ------ ------ ------- -----
Old-age and survivors trust fund.. 175.1 59.7 187.7 201.7 2357.6 51.7
Civil service retirement & disabil 11.7 4.0 31.8 33.4 766.9 16.8
Hospital insurance trust fund..... 17.2 5.9 -5.3 10.9 324.9 7.1
Military retirement trust fund.... 8.4 2.9 25.2 32.6 248.0 5.4
Disability insurance trust fund... 11.7 4.0 4.1 3.4 221.3 4.9
Medicare-eligible retiree health.. 19.5 6.6 41.7 25.5 159.4 3.5
Unemployment trust fund........... 8.7 3.0 9.1 8.0 92.0 2.0
Supplementary medical insurance... 6.2 2.1 9.5 7.6 56.3 1.2
Federal Deposit Insurance Corp.... 1.5 0.5 2.0 3.1 55.8 1.2
Employees life ins & health benfts 2.8 0.9 1.6 1.7 52.1 1.1
Postal Service retiree health fund 25.5 8.7 6.8 6.9 39.2 0.9
Housing and Urban Development..... 0.7 0.3 0.1 0.2 31.5 0.7
Nuclear waste disposal fund....... 1.3 0.5 0.9 0.9 21.8 0.5
Exchange stabilization fund....... 0.7 0.2 0.9 0.9 18.2 0.4
Foreign service retirement & disab 0.5 0.2 0.5 0.5 15.4 0.3
Pension Benefit Guaranty Corp..... -0.5 -0.2 -0.1 0.1 14.5 0.3
Veteran affairs life insurance.... -0.4 -0.1 -0.5 -0.5 10.7 0.2
Highway and Airport trust funds... 1.4 0.5 -4.9 -7.5 8.6 0.2
Other government accounts......... 1.2 0.4 -0.6 2.0 62.9 1.4
--------------------------------------------------------------------------------
Total investment in Federal debt.. 293.2 100.0 310.2 331.4 4557.3 100.0
Source: Budget of the United States Government, FY 2009,
Analytical Perspectives, page 236, table 16-4
Go to Budget Home Page
