RECEIPTS, OUTLAYS, AND SURPLUSES OR DEFICITS(-): 1940-2019
(billions of dollars)
Public
Total Total Unified Public Def w/o Gross OASDI Medicare
Year Receipts Outlays Deficit Deficit OASDI Deficit Surplus Surplus GDP
---- -------- ------- ------- ------- ------- ------- ------- ------- -------
1940 6.5 9.5 -2.9 0.6 96.8
1941 8.7 13.7 -4.9 -5.5 -6.1 -6.8 0.7 114.1
1942 14.6 35.1 -20.5 -19.5 -20.4 -21.7 0.8 144.3
1943 24.0 78.6 -54.6 -60.0 -61.1 -63.4 1.0 180.3
1944 43.7 91.3 -47.6 -57.0 -58.2 -61.4 1.2 209.2
1945 45.2 92.7 -47.6 -50.4 -51.6 -56.0 1.2 221.4
1946 39.3 55.2 -15.9 -6.7 -7.7 -10.9 1.0 222.7
1947 38.5 34.5 4.0 17.5 16.4 13.8 1.2 233.2
1948 41.6 29.8 11.8 8.1 6.8 5.1 1.2 256.0
1949 39.4 38.8 0.6 1.9 0.7 -0.6 1.3 271.1
1950 39.4 42.6 -3.1 -4.7 -6.3 -4.2 1.6 273.0
1951 51.6 45.5 6.1 4.7 2.9 1.6 1.8 320.6
1952 66.2 67.7 -1.5 -0.4 -2.3 -3.8 1.9 348.6
1953 69.6 76.1 -6.5 -3.6 -5.4 -6.9 1.8 372.9
1954 69.7 70.9 -1.2 -6.1 -7.8 -4.8 1.7 377.3
1955 65.5 68.4 -3.0 -2.1 -3.2 -3.6 1.1 394.6
1956 74.6 70.6 3.9 4.5 3.0 1.7 1.5 427.2
1957 80.0 76.6 3.4 2.8 2.1 0.4 0.8 450.3
1958 79.6 82.4 -2.8 -7.0 -7.6 -7.4 0.5 460.5
1959 79.2 92.1 -12.8 -8.4 -7.7 -7.8 -0.7 491.5
1960 92.5 92.2 0.3 -2.1 -1.9 -3.1 -0.2 517.9
1961 94.4 97.7 -3.3 -1.5 -1.9 -2.1 0.4 530.8
1962 99.7 106.8 -7.1 -9.7 -8.4 -10.3 -1.3 567.6
1963 106.6 111.3 -4.8 -6.0 -5.2 -7.4 -0.8 598.7
1964 112.6 118.5 -5.9 -2.9 -3.5 -5.7 0.6 640.4
1965 116.8 118.2 -1.4 -3.9 -4.1 -6.3 0.2 0.0 687.1
1966 130.8 134.5 -3.7 -2.9 -2.3 -6.2 -0.6 0.9 752.9
1967 148.8 157.5 -8.6 -2.9 -6.9 -11.9 4.0 1.0 811.8
1968 153.0 178.1 -25.2 -22.9 -25.5 -28.2 2.6 -0.1 866.6
1969 186.9 183.6 3.2 11.4 7.7 2.9 3.7 0.7 948.6
1970 192.8 195.6 -2.8 -5.1 -10.9 -15.2 5.9 0.3 1012.2
1971 187.1 210.2 -23.0 -19.8 -22.9 -27.3 3.0 0.7 1079.9
1972 207.3 230.7 -23.4 -19.3 -22.4 -27.8 3.1 -0.1 1178.3
1973 230.8 245.7 -14.9 -18.5 -19.0 -30.4 0.5 1.8 1307.6
1974 263.2 269.4 -6.1 -2.8 -4.6 -17.6 1.8 4.1 1439.3
1975 279.1 332.3 -53.2 -51.0 -53.0 -58.0 2.0 2.1 1560.7
1976 298.1 371.8 -73.7 -82.7 -79.5 -87.0 -3.2 0.7 1736.5
1977 355.6 409.2 -53.7 -71.7 -66.4 -77.4 -3.9 1.2 1974.3
1978 399.6 458.7 -59.2 -58.0 -53.8 -70.2 -4.3 2.4 2217.0
1979 463.3 504.0 -40.7 -33.2 -31.2 -52.9 -2.0 2.6 2500.7
1980 517.1 590.9 -73.8 -71.6 -70.5 -79.6 -1.1 0.7 2726.7
1981 599.3 678.2 -79.0 -77.5 -72.5 -85.8 -5.0 2.8 3054.7
1982 617.8 745.7 -128.0 -135.2 -127.2 -142.5 -7.9 4.8 3227.6
1983 600.6 808.4 -207.8 -212.7 -225.3 -234.3 0.2 6.2 3440.7
1984 666.5 851.9 -185.4 -169.7 -170.0 -192.9 0.3 5.6 3840.2
1985 734.1 946.4 -212.3 -200.3 -207.8 -252.8 9.4 4.1 4141.5
1986 769.2 990.4 -221.2 -233.4 -239.5 -303.1 16.7 5.5 4412.4
1987 854.4 1004.1 -149.7 -149.1 -168.7 -225.5 19.6 8.9 4647.1
1988 909.3 1064.5 -155.2 -161.9 -200.7 -255.1 38.8 15.3 5008.6
1989 991.2 1143.8 -152.6 -139.1 -191.5 -266.7 52.4 22.4 5400.5
1990 1032.1 1253.1 -221.0 -220.8 -279.1 -338.5 58.2 15.5 5735.4
1991 1055.1 1324.3 -269.2 -277.4 -331.0 -391.9 53.5 15.4 5935.1
1992 1091.3 1381.6 -290.3 -310.7 -361.5 -403.6 50.7 13.6 6239.9
1993 1154.5 1409.5 -255.1 -248.7 -295.4 -349.3 46.8 10.2 6575.5
1994 1258.7 1461.9 -203.2 -184.7 -241.4 -292.3 56.8 1.1 6961.3
1995 1351.9 1515.9 -164.0 -171.3 -231.8 -277.3 60.4 -7.1 7325.8
1996 1453.2 1560.6 -107.4 -129.7 -196.1 -260.9 66.4 8.9 7694.1
1997 1579.4 1601.3 -21.9 -38.3 -119.6 -187.7 81.3 -1.1 8182.4
1998 1722.0 1652.7 69.3 51.2 -48.2 -109.0 99.4 6.6 8627.9
1999 1827.6 1702.0 125.6 88.7 -36.0 -127.3 124.7 26.3 9125.3
2000 2025.5 1789.2 236.2 222.6 70.7 -23.2 151.8 29.9 9709.8
2001 1991.4 1863.2 128.2 90.2 -72.8 -141.2 163.0 25.2 10057.9
2002 1853.4 2011.2 -157.8 -220.8 -379.9 -428.5 159.1 28.6 10377.4
2003 1782.5 2160.1 -377.6 -373.0 -528.7 -561.6 155.7 8.1 10808.6
2004 1880.3 2293.0 -412.7 -382.1 -533.0 -594.6 150.9 6.1 11499.9
2005 2153.9 2472.2 -318.3 -296.7 -470.2 -550.6 173.5 12.5 12237.9
2006 2407.3 2655.4 -248.2 -236.8 -422.0 -546.1 185.2 41.8 13015.5
2007 2568.2 2730.2 -162.0 -206.2 -392.8 -499.4 186.6 22.1 13667.5
2008 2524.0 2983.0 -459.0 -767.9 -1035.3 14222.0
2009* 2186.0 3938.0 -1752.0 -2561.0 -2718.0 14240.0
2010* 2381.0 3552.0 -1171.0 -1145.0 -1374.0 14729.0
2011* 2713.0 3625.0 -912.0 -927.0 -1194.0 15500.0
2012* 3081.0 3662.0 -581.0 -549.0 -921.0 16470.0
2013* 3323.0 3856.0 -533.0 -520.0 -923.0 17498.0
2014* 3500.0 4069.0 -570.0 -565.0 -949.0 18386.0
2015* 3675.0 4258.0 -583.0 -589.0 -961.0 19205.0
2016* 3856.0 4493.0 -637.0 -638.0 -992.0 20060.0
2017* 4042.0 4678.0 -636.0 -635.0 -993.0 20952.0
2018* 4234.0 4868.0 -634.0 -625.0 -988.0 21884.0
2019* 4446.0 5158.0 -712.0 -813.0 -1141.0 22858.0
RECEIPTS, OUTLAYS, AND SURPLUSES OR DEFICITS(-) FROM 2009 BUDGET: 2008-2013
(billions of dollars)
Public
Total Total Unified Public Def w/o Gross OASDI Medicare
Year Receipts Outlays Deficit Deficit OASDI Deficit Surplus Surplus GDP
---- -------- ------- ------- ------- ------- ------- ------- ------- -------
2008* 2521.2 2931.2 -410.0 -393.5 -586.6 -703.7 193.1 17.8 14311.5
2009* 2699.9 3107.4 -407.4 -427.5 -632.3 -759.0 204.8 17.8 15027.0
2010* 2931.3 3091.3 -160.0 -174.9 -399.7 -541.0 224.8 22.2 15792.0
2011* 3076.4 3171.2 -94.8 -108.6 -349.7 -502.1 241.1 21.6 16580.2
2012* 3269.9 3221.8 48.1 30.2 -220.9 -411.7 251.1 50.8 17395.0
2013* 3428.2 3398.9 29.3 12.1 -217.8 -408.3 229.9 45.2 18243.3
-------------------------------------------------------------------------------------
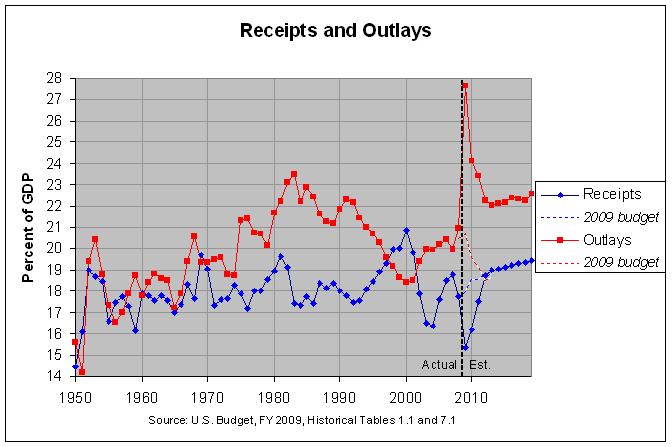
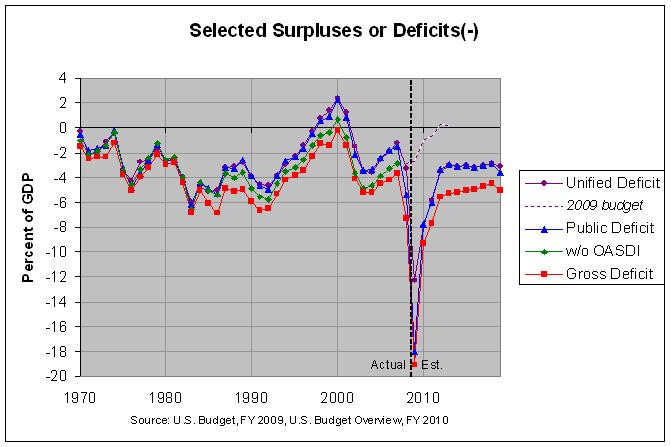
RECEIPTS, OUTLAYS, AND SURPLUSES OR DEFICITS(-): 1940-2019
(percentage of GDP)
Public
Total Total Unified Public Def w/o Gross OASDI Medicare GDP
Year Receipts Outlays Deficit Deficit OASDI Deficit Surplus Surplus ($bil)
---- -------- -------- -------- -------- -------- -------- -------- -------- --------
1940 6.8 9.8 -3.0 0.6 96.8
1941 7.6 12.0 -4.3 -4.8 -5.3 -6.0 0.6 114.1
1942 10.1 24.3 -14.2 -13.5 -14.1 -15.0 0.6 144.3
1943 13.3 43.6 -30.3 -33.3 -33.9 -35.2 0.6 180.3
1944 20.9 43.6 -22.7 -27.3 -27.8 -29.4 0.6 209.2
1945 20.4 41.9 -21.5 -22.8 -23.3 -25.3 0.5 221.4
1946 17.6 24.8 -7.2 -3.0 -3.5 -4.9 0.5 222.7
1947 16.5 14.8 1.7 7.5 7.0 5.9 0.5 233.2
1948 16.2 11.6 4.6 3.2 2.7 2.0 0.5 256.0
1949 14.5 14.3 0.2 0.7 0.3 -0.2 0.5 271.1
1950 14.4 15.6 -1.1 -1.7 -2.3 -1.6 0.6 273.0
1951 16.1 14.2 1.9 1.5 0.9 0.5 0.6 320.6
1952 19.0 19.4 -0.4 -0.1 -0.7 -1.1 0.5 348.6
1953 18.7 20.4 -1.7 -1.0 -1.4 -1.8 0.5 372.9
1954 18.5 18.8 -0.3 -1.6 -2.1 -1.3 0.4 377.3
1955 16.6 17.3 -0.8 -0.5 -0.8 -0.9 0.3 394.6
1956 17.5 16.5 0.9 1.0 0.7 0.4 0.3 427.2
1957 17.8 17.0 0.8 0.6 0.5 0.1 0.2 450.3
1958 17.3 17.9 -0.6 -1.5 -1.6 -1.6 0.1 460.5
1959 16.1 18.7 -2.6 -1.7 -1.6 -1.6 -0.1 491.5
1960 17.9 17.8 0.1 -0.4 -0.4 -0.6 0.0 517.9
1961 17.8 18.4 -0.6 -0.3 -0.4 -0.4 0.1 530.8
1962 17.6 18.8 -1.3 -1.7 -1.5 -1.8 -0.2 567.6
1963 17.8 18.6 -0.8 -1.0 -0.9 -1.2 -0.1 598.7
1964 17.6 18.5 -0.9 -0.4 -0.5 -0.9 0.1 640.4
1965 17.0 17.2 -0.2 -0.6 -0.6 -0.9 0.0 0.0 687.1
1966 17.4 17.9 -0.5 -0.4 -0.3 -0.8 -0.1 0.1 752.9
1967 18.3 19.4 -1.1 -0.4 -0.8 -1.5 0.5 0.1 811.8
1968 17.7 20.6 -2.9 -2.6 -2.9 -3.3 0.3 0.0 866.6
1969 19.7 19.4 0.3 1.2 0.8 0.3 0.4 0.1 948.6
1970 19.0 19.3 -0.3 -0.5 -1.1 -1.5 0.6 0.0 1012.2
1971 17.3 19.5 -2.1 -1.8 -2.1 -2.5 0.3 0.1 1079.9
1972 17.6 19.6 -2.0 -1.6 -1.9 -2.4 0.3 0.0 1178.3
1973 17.7 18.8 -1.1 -1.4 -1.5 -2.3 0.0 0.1 1307.6
1974 18.3 18.7 -0.4 -0.2 -0.3 -1.2 0.1 0.3 1439.3
1975 17.9 21.3 -3.4 -3.3 -3.4 -3.7 0.1 0.1 1560.7
1976 17.2 21.4 -4.2 -4.8 -4.6 -5.0 -0.2 0.0 1736.5
1977 18.0 20.7 -2.7 -3.6 -3.4 -3.9 -0.2 0.1 1974.3
1978 18.0 20.7 -2.7 -2.6 -2.4 -3.2 -0.2 0.1 2217.0
1979 18.5 20.2 -1.6 -1.3 -1.2 -2.1 -0.1 0.1 2500.7
1980 19.0 21.7 -2.7 -2.6 -2.6 -2.9 0.0 0.0 2726.7
1981 19.6 22.2 -2.6 -2.5 -2.4 -2.8 -0.2 0.1 3054.7
1982 19.1 23.1 -4.0 -4.2 -3.9 -4.4 -0.2 0.1 3227.6
1983 17.5 23.5 -6.0 -6.2 -6.5 -6.8 0.0 0.2 3440.7
1984 17.4 22.2 -4.8 -4.4 -4.4 -5.0 0.0 0.1 3840.2
1985 17.7 22.9 -5.1 -4.8 -5.0 -6.1 0.2 0.1 4141.5
1986 17.4 22.4 -5.0 -5.3 -5.4 -6.9 0.4 0.1 4412.4
1987 18.4 21.6 -3.2 -3.2 -3.6 -4.9 0.4 0.2 4647.1
1988 18.2 21.3 -3.1 -3.2 -4.0 -5.1 0.8 0.3 5008.6
1989 18.4 21.2 -2.8 -2.6 -3.5 -4.9 1.0 0.4 5400.5
1990 18.0 21.8 -3.9 -3.9 -4.9 -5.9 1.0 0.3 5735.4
1991 17.8 22.3 -4.5 -4.7 -5.6 -6.6 0.9 0.3 5935.1
1992 17.5 22.1 -4.7 -5.0 -5.8 -6.5 0.8 0.2 6239.9
1993 17.6 21.4 -3.9 -3.8 -4.5 -5.3 0.7 0.2 6575.5
1994 18.1 21.0 -2.9 -2.7 -3.5 -4.2 0.8 0.0 6961.3
1995 18.5 20.7 -2.2 -2.3 -3.2 -3.8 0.8 -0.1 7325.8
1996 18.9 20.3 -1.4 -1.7 -2.5 -3.4 0.9 0.1 7694.1
1997 19.3 19.6 -0.3 -0.5 -1.5 -2.3 1.0 0.0 8182.4
1998 20.0 19.2 0.8 0.6 -0.6 -1.3 1.2 0.1 8627.9
1999 20.0 18.7 1.4 1.0 -0.4 -1.4 1.4 0.3 9125.3
2000 20.9 18.4 2.4 2.3 0.7 -0.2 1.6 0.3 9709.8
2001 19.8 18.5 1.3 0.9 -0.7 -1.4 1.6 0.3 10057.9
2002 17.9 19.4 -1.5 -2.1 -3.7 -4.1 1.5 0.3 10377.4
2003 16.5 20.0 -3.5 -3.5 -4.9 -5.2 1.4 0.1 10808.6
2004 16.4 19.9 -3.6 -3.3 -4.6 -5.2 1.3 0.1 11499.9
2005 17.6 20.2 -2.6 -2.4 -3.8 -4.5 1.4 0.1 12237.9
2006 18.5 20.4 -1.9 -1.8 -3.2 -4.2 1.4 0.3 13015.5
2007 18.8 20.0 -1.2 -1.5 -2.9 -3.7 1.4 0.2 13667.5
2008 17.7 21.0 -3.2 -5.4 -7.3 14222.0
2009* 15.4 27.7 -12.3 -18.0 -19.1 14240.0
2010* 16.2 24.1 -8.0 -7.8 -9.3 14729.0
2011* 17.5 23.4 -5.9 -6.0 -7.7 15500.0
2012* 18.7 22.2 -3.5 -3.3 -5.6 16470.0
2013* 19.0 22.0 -3.0 -3.0 -5.3 17498.0
2014* 19.0 22.1 -3.1 -3.1 -5.2 18386.0
2015* 19.1 22.2 -3.0 -3.1 -5.0 19205.0
2016* 19.2 22.4 -3.2 -3.2 -4.9 20060.0
2017* 19.3 22.3 -3.0 -3.0 -4.7 20952.0
2018* 19.3 22.2 -2.9 -2.9 -4.5 21884.0
2019* 19.5 22.6 -3.1 -3.6 -5.0 22858.0
RECEIPTS, OUTLAYS, AND SURPLUSES OR DEFICITS(-) FROM 2009 BUDGET: 2008-2013
(percentage of GDP)
Public
Total Total Unified Public Def w/o Gross OASDI Medicare
Year Receipts Outlays Deficit Deficit OASDI Deficit Surplus Surplus GDP
---- -------- -------- -------- -------- -------- -------- -------- -------- --------
2008* 17.6 20.5 -2.9 -2.7 -4.1 -4.9 1.3 0.1 14311.5
2009* 18.0 20.7 -2.7 -2.8 -4.2 -5.1 1.4 0.1 15027.0
2010* 18.6 19.6 -1.0 -1.1 -2.5 -3.4 1.4 0.1 15792.0
2011* 18.6 19.1 -0.6 -0.7 -2.1 -3.0 1.5 0.1 16580.2
2012* 18.8 18.5 0.3 0.2 -1.3 -2.4 1.4 0.3 17395.0
2013* 18.8 18.6 0.2 0.1 -1.2 -2.2 1.3 0.2 18243.3
* estimated
Note: Public Deficit equals change in Public Debt; Gross Deficit equals change in
Gross Debt; Gross Debt equals debt held by the public (called Public Debt
here) plus debt held by government accounts; OASDI includes Old-Age and
Survivors Insurance Fund (OAS) and Disability Insurance Fund (DI);
negative numbers denote deficits
Source: years 2008-2019: Budget Overview Document, FY 2010, tables S-1 and S-9;
all other years: Budget of the United States Government, FY 2009,
Historical Tables, tables 7.1, 10.1, 13.1
================================================================================
DEBT HELD BY GOVERNMENT ACCOUNTS (billions of dollars)
Investment or disinvestment Holdings
------------------------------ end of
2007 % of 2008 2009 2009 % of
Description actual total est. est. est. total
---------------------------------- ------ ----- ------ ------ ------- -----
Old-age and survivors trust fund.. 175.1 59.7 187.7 201.7 2357.6 51.7
Civil service retirement & disabil 11.7 4.0 31.8 33.4 766.9 16.8
Hospital insurance trust fund..... 17.2 5.9 -5.3 10.9 324.9 7.1
Military retirement trust fund.... 8.4 2.9 25.2 32.6 248.0 5.4
Disability insurance trust fund... 11.7 4.0 4.1 3.4 221.3 4.9
Medicare-eligible retiree health.. 19.5 6.6 41.7 25.5 159.4 3.5
Unemployment trust fund........... 8.7 3.0 9.1 8.0 92.0 2.0
Supplementary medical insurance... 6.2 2.1 9.5 7.6 56.3 1.2
Federal Deposit Insurance Corp.... 1.5 0.5 2.0 3.1 55.8 1.2
Employees life ins & health benfts 2.8 0.9 1.6 1.7 52.1 1.1
Postal Service retiree health fund 25.5 8.7 6.8 6.9 39.2 0.9
Housing and Urban Development..... 0.7 0.3 0.1 0.2 31.5 0.7
Nuclear waste disposal fund....... 1.3 0.5 0.9 0.9 21.8 0.5
Exchange stabilization fund....... 0.7 0.2 0.9 0.9 18.2 0.4
Foreign service retirement & disab 0.5 0.2 0.5 0.5 15.4 0.3
Pension Benefit Guaranty Corp..... -0.5 -0.2 -0.1 0.1 14.5 0.3
Veteran affairs life insurance.... -0.4 -0.1 -0.5 -0.5 10.7 0.2
Highway and Airport trust funds... 1.4 0.5 -4.9 -7.5 8.6 0.2
Other government accounts......... 1.2 0.4 -0.6 2.0 62.9 1.4
--------------------------------------------------------------------------------
Total investment in Federal debt.. 293.2 100.0 310.2 331.4 4557.3 100.0
Source: Budget of the United States Government, FY 2009,
Analytical Perspectives, page 236, table 16-4
Go to Budget Home Page
