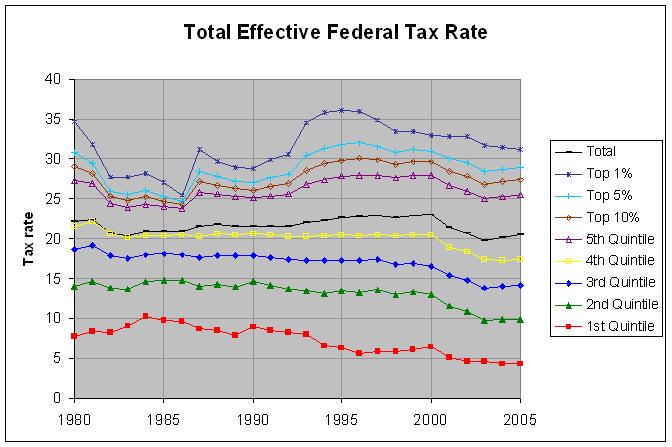
TOTAL EFFECTIVE FEDERAL TAX RATE
Total
Lowest Second Middle Fourth Highest Tax
Year Total Quintile Quintile Quintile Quintile Quintile Top 10% Top 5% Top 1% Revenue*
---- -------- -------- -------- -------- -------- -------- -------- -------- -------- --------
1979 22.2 8.0 14.3 18.6 21.2 27.5 29.6 31.8 37.0 18.5
1980 22.2 7.7 14.1 18.7 21.5 27.3 29.0 30.8 34.6 19.0
1981 22.4 8.3 14.7 19.2 22.1 26.9 28.2 29.4 31.8 19.6
1982 20.7 8.2 13.8 17.9 20.6 24.4 25.3 26.0 27.7 19.1
1983 20.4 9.1 13.7 17.5 20.1 23.9 24.8 25.6 27.7 17.5
1984 21.0 10.2 14.6 18.0 20.4 24.3 25.2 26.1 28.2 17.4
1985 20.9 9.8 14.8 18.1 20.4 24.0 24.7 25.4 27.0 17.7
1986 20.9 9.6 14.8 18.0 20.5 23.8 24.3 24.6 25.5 17.4
1987 21.6 8.7 14.0 17.6 20.2 25.8 27.2 28.5 31.2 18.4
1988 21.8 8.5 14.3 17.9 20.6 25.6 26.7 27.8 29.7 18.2
1989 21.5 7.9 13.9 17.9 20.5 25.2 26.3 27.2 28.9 18.4
1990 21.5 8.9 14.6 17.9 20.6 25.1 26.1 27.0 28.8 18.0
1991 21.5 8.4 14.2 17.6 20.5 25.3 26.6 27.6 29.9 17.8
1992 21.5 8.2 13.7 17.4 20.2 25.6 26.9 28.1 30.6 17.5
1993 22.0 8.0 13.5 17.3 20.2 26.8 28.6 30.5 34.5 17.6
1994 22.3 6.6 13.1 17.3 20.4 27.4 29.4 31.3 35.8 18.1
1995 22.6 6.3 13.4 17.3 20.5 27.8 29.8 31.8 36.1 18.5
1996 22.7 5.6 13.2 17.3 20.3 28.0 30.1 32.0 36.0 18.9
1997 22.9 5.8 13.6 17.4 20.5 28.0 29.9 31.6 34.9 19.3
1998 22.6 5.8 13.0 16.8 20.4 27.6 29.3 30.8 33.4 20.0
1999 22.9 6.1 13.3 16.9 20.5 28.0 29.7 31.2 33.5 20.0
2000 23.0 6.4 13.0 16.6 20.5 28.0 29.6 31.0 33.0 20.9
2001 21.4 5.1 11.5 15.3 18.9 26.7 28.5 30.0 32.8 19.8
2002 20.7 4.7 10.8 14.8 18.3 26.0 27.9 29.5 32.8 17.9
2003 19.8 4.6 9.8 13.8 17.4 25.0 26.8 28.5 31.7 16.5
2004 20.1 4.3 9.9 14.1 17.3 25.2 27.1 28.7 31.4 16.4
2005 20.5 4.3 9.9 14.2 17.4 25.5 27.4 28.9 31.2 17.6
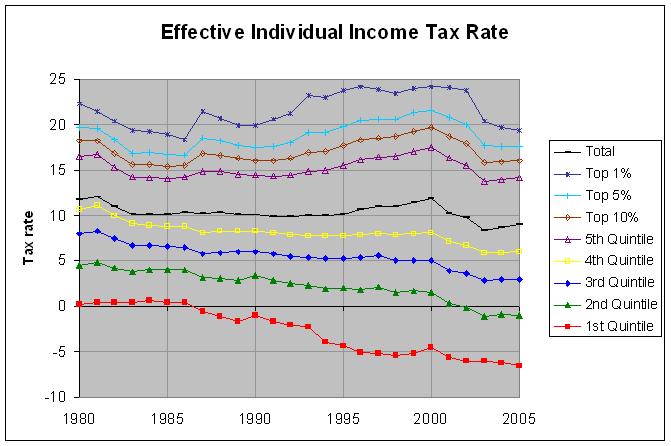
EFFECTIVE INDIVIDUAL INCOME TAX RATE
Individ
Lowest Second Middle Fourth Highest Income
Year Total Quintile Quintile Quintile Quintile Quintile Top 10% Top 5% Top 1% Taxes*
---- -------- -------- -------- -------- -------- -------- -------- -------- -------- --------
1979 11.0 0.0 4.1 7.5 10.1 15.7 17.4 19.0 21.8 8.71
1980 11.7 0.2 4.5 8.0 10.7 16.5 18.2 19.7 22.3 8.95
1981 12.0 0.5 4.8 8.3 11.1 16.7 18.2 19.6 21.5 9.36
1982 11.0 0.4 4.2 7.4 10.0 15.3 16.9 18.3 20.4 9.22
1983 10.2 0.4 3.8 6.7 9.1 14.2 15.6 16.9 19.4 8.40
1984 10.2 0.7 4.0 6.7 8.9 14.1 15.6 17.0 19.3 7.77
1985 10.2 0.5 4.0 6.6 8.8 14.0 15.4 16.7 18.9 8.08
1986 10.4 0.4 4.0 6.5 8.8 14.2 15.5 16.6 18.3 7.91
1987 10.3 -0.6 3.2 5.8 8.1 14.9 16.8 18.5 21.5 8.45
1988 10.4 -1.1 3.1 5.9 8.3 14.9 16.6 18.2 20.7 8.01
1989 10.2 -1.6 2.9 6.0 8.3 14.6 16.3 17.7 19.9 8.25
1990 10.1 -1.0 3.4 6.0 8.3 14.4 16.0 17.5 19.9 8.14
1991 9.9 -1.6 2.9 5.8 8.1 14.3 16.0 17.6 20.6 7.88
1992 9.9 -2.1 2.5 5.5 7.9 14.5 16.3 18.0 21.2 7.63
1993 10.0 -2.3 2.3 5.4 7.8 14.9 17.0 19.1 23.2 7.75
1994 10.0 -3.9 1.9 5.3 7.8 15.0 17.1 19.2 23.0 7.80
1995 10.2 -4.4 2.0 5.3 7.8 15.5 17.7 19.8 23.7 8.06
1996 10.7 -5.1 1.8 5.4 7.9 16.1 18.3 20.5 24.2 8.53
1997 11.0 -5.2 2.1 5.6 8.0 16.4 18.5 20.6 23.8 9.01
1998 11.0 -5.4 1.5 5.0 7.9 16.5 18.7 20.6 23.4 9.60
1999 11.4 -5.2 1.7 5.0 8.0 17.1 19.3 21.3 24.0 9.64
2000 11.8 -4.6 1.5 5.0 8.1 17.5 19.7 21.6 24.2 10.34
2001 10.3 -5.6 0.3 3.9 7.1 16.3 18.7 20.8 24.1 9.89
2002 9.7 -6.0 -0.2 3.6 6.7 15.5 17.9 20.0 23.7 8.27
2003 8.4 -6.0 -1.1 2.8 5.9 13.7 15.8 17.7 20.4 7.34
2004 8.7 -6.2 -0.9 3.0 5.9 13.9 15.9 17.6 19.7 7.03
2005 9.0 -6.5 -1.0 3.0 6.0 14.1 16.0 17.6 19.4 7.58
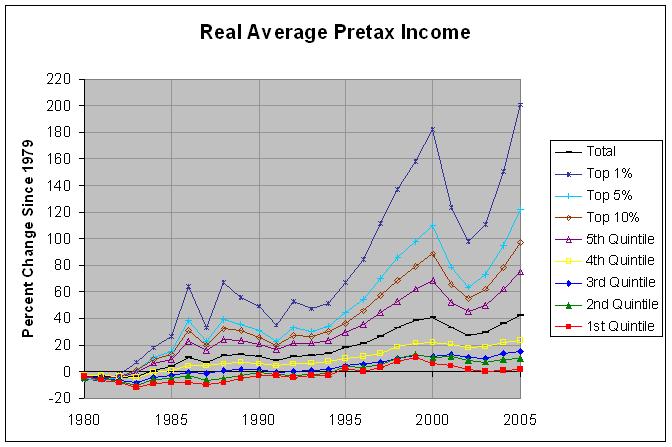
AVERAGE PRETAX INCOME (thousands of 2005 dollars)
Lowest Second Middle Fourth Highest
Year Total Quintile Quintile Quintile Quintile Quintile Top 10% Top 5% Top 1%
---- -------- -------- -------- -------- -------- -------- -------- -------- --------
1979 59.7 15.7 34.0 51.0 69.0 132.1 172.2 234.2 517.8
1980 57.7 15.1 32.6 49.3 66.9 127.8 166.4 223.1 488.2
1981 57.6 14.7 32.3 48.6 67.2 126.8 164.3 219.1 484.8
1982 57.3 14.3 31.5 47.6 66.4 126.8 165.8 224.0 505.7
1983 57.7 13.8 30.3 46.8 66.0 131.1 173.6 236.0 553.6
1984 60.3 14.2 32.1 48.8 68.7 140.2 188.0 258.7 609.4
1985 61.7 14.3 32.2 49.6 69.4 143.9 194.3 269.2 654.4
1986 66.3 14.3 33.0 50.8 72.0 162.4 224.7 324.2 851.9
1987 64.0 14.1 31.8 50.4 72.1 153.0 207.1 287.4 688.6
1988 66.9 14.3 32.4 51.2 72.9 164.6 227.5 326.3 867.3
1989 67.4 14.9 33.0 51.8 73.8 163.7 225.1 318.4 807.1
1990 66.7 15.3 33.8 51.6 72.9 159.0 217.0 305.5 774.5
1991 64.9 15.3 33.3 50.8 72.1 153.4 207.2 286.9 698.2
1992 66.7 15.0 33.1 51.1 72.8 160.1 219.4 311.0 791.7
1993 67.0 15.3 33.3 51.4 73.4 160.2 217.8 304.9 760.7
1994 67.8 15.2 33.6 51.8 74.6 163.4 223.7 314.7 784.3
1995 70.4 16.0 35.2 53.2 75.8 171.1 235.2 337.8 864.4
1996 72.7 15.7 35.0 53.9 77.1 179.7 251.4 362.0 953.4
1997 75.6 16.1 35.8 54.7 78.5 190.5 270.7 398.9 1093.4
1998 79.3 16.9 37.4 56.1 81.6 202.1 290.4 434.9 1228.0
1999 82.7 17.4 38.4 57.3 83.7 214.2 309.2 463.5 1336.6
2000 84.0 16.6 37.7 57.0 84.5 222.6 324.3 491.8 1460.6
2001 79.3 16.4 38.0 57.7 83.2 201.4 285.4 418.4 1156.0
2002 75.9 15.9 36.8 56.4 81.3 191.4 267.1 383.1 1024.1
2003 77.0 15.7 36.4 56.1 82.0 197.8 278.6 405.2 1092.8
2004 81.3 15.8 37.2 58.0 84.5 214.5 307.8 457.4 1299.3
2005 84.8 15.9 37.4 58.5 85.2 231.3 339.1 520.2 1558.5
PERCENT INCREASE IN AVERAGE PRETAX INCOME SINCE 1979
Lowest Second Middle Fourth Highest
Year Total Quintile Quintile Quintile Quintile Quintile Top 10% Top 5% Top 1%
---- -------- -------- -------- -------- -------- -------- -------- -------- --------
1979 0.0 0.0 0.0 0.0 0.0 0.0 0.0 0.0 0.0
1980 -3.4 -3.8 -4.1 -3.3 -3.0 -3.3 -3.4 -4.7 -5.7
1981 -3.5 -6.4 -5.0 -4.7 -2.6 -4.0 -4.6 -6.4 -6.4
1982 -4.0 -8.9 -7.4 -6.7 -3.8 -4.0 -3.7 -4.4 -2.3
1983 -3.4 -12.1 -10.9 -8.2 -4.3 -0.8 0.8 0.8 6.9
1984 1.0 -9.6 -5.6 -4.3 -0.4 6.1 9.2 10.5 17.7
1985 3.4 -8.9 -5.3 -2.7 0.6 8.9 12.8 14.9 26.4
1986 11.1 -8.9 -2.9 -0.4 4.3 22.9 30.5 38.4 64.5
1987 7.2 -10.2 -6.5 -1.2 4.5 15.8 20.3 22.7 33.0
1988 12.1 -8.9 -4.7 0.4 5.7 24.6 32.1 39.3 67.5
1989 12.9 -5.1 -2.9 1.6 7.0 23.9 30.7 36.0 55.9
1990 11.7 -2.5 -0.6 1.2 5.7 20.4 26.0 30.4 49.6
1991 8.7 -2.5 -2.1 -0.4 4.5 16.1 20.3 22.5 34.8
1992 11.7 -4.5 -2.6 0.2 5.5 21.2 27.4 32.8 52.9
1993 12.2 -2.5 -2.1 0.8 6.4 21.3 26.5 30.2 46.9
1994 13.6 -3.2 -1.2 1.6 8.1 23.7 29.9 34.4 51.5
1995 17.9 1.9 3.5 4.3 9.9 29.5 36.6 44.2 66.9
1996 21.8 0.0 2.9 5.7 11.7 36.0 46.0 54.6 84.1
1997 26.6 2.5 5.3 7.3 13.8 44.2 57.2 70.3 111.2
1998 32.8 7.6 10.0 10.0 18.3 53.0 68.6 85.7 137.2
1999 38.5 10.8 12.9 12.4 21.3 62.1 79.6 97.9 158.1
2000 40.7 5.7 10.9 11.8 22.5 68.5 88.3 110.0 182.1
2001 32.8 4.5 11.8 13.1 20.6 52.5 65.7 78.7 123.3
2002 27.1 1.3 8.2 10.6 17.8 44.9 55.1 63.6 97.8
2003 29.0 0.0 7.1 10.0 18.8 49.7 61.8 73.0 111.0
2004 36.2 0.6 9.4 13.7 22.5 62.4 78.7 95.3 150.9
2005 42.0 1.3 10.0 14.7 23.5 75.1 96.9 122.1 201.0
MINIMUM ADJUSTED INCOME (thousands of 2005 dollars)
Lowest Second Middle Fourth Highest
Year Total Quintile Quintile Quintile Quintile Quintile Top 10% Top 5% Top 1%
---- -------- -------- -------- -------- -------- -------- -------- -------- --------
1979 NA 0.0 16.4 26.0 35.6 49.7 63.6 80.6 157.7
1980 NA 0.0 15.7 25.1 34.6 48.5 62.7 78.8 152.9
1981 NA 0.0 15.5 24.9 34.8 48.9 62.8 79.5 150.6
1982 NA 0.0 15.1 24.3 34.3 48.9 63.1 79.0 151.2
1983 NA 0.0 14.4 24.1 34.3 49.2 63.8 80.8 157.7
1984 NA 0.0 15.3 25.1 35.9 51.3 67.2 85.2 168.4
1985 NA 0.0 15.4 25.5 36.4 52.0 68.3 87.3 175.0
1986 NA 0.0 15.5 26.2 37.6 54.3 71.5 92.7 203.3
1987 NA 0.0 15.0 26.1 37.9 55.0 72.5 92.6 190.8
1988 NA 0.0 15.4 26.7 38.6 56.0 74.2 95.3 205.2
1989 NA 0.0 15.7 27.1 39.0 56.8 75.3 97.6 208.0
1990 NA 0.0 16.1 27.1 38.8 56.0 74.0 96.0 198.4
1991 NA 0.0 16.1 26.6 38.4 55.2 72.9 94.4 194.6
1992 NA 0.0 15.7 26.7 38.7 55.9 74.2 97.3 205.8
1993 NA 0.0 15.9 26.8 38.7 56.3 74.7 97.0 202.5
1994 NA 0.0 16.1 27.2 39.6 57.2 75.8 99.1 208.6
1995 NA 0.0 16.9 28.1 40.3 58.7 78.5 103.2 221.9
1996 NA 0.0 16.6 28.4 40.9 59.9 80.6 106.2 234.3
1997 NA 0.0 17.0 28.8 41.5 61.3 83.0 111.4 248.6
1998 NA 0.0 17.8 29.9 43.0 63.6 86.6 116.2 265.3
1999 NA 0.0 18.3 30.5 43.9 65.5 89.1 119.8 283.1
2000 NA 0.0 17.9 30.3 44.1 66.2 90.7 122.8 290.9
2001 NA 0.0 18.1 30.5 44.3 65.6 88.5 118.3 262.4
2002 NA 0.0 17.7 29.7 43.4 64.1 86.6 115.0 249.6
2003 NA 0.0 17.4 29.5 43.3 65.0 87.3 116.5 253.6
2004 NA 0.0 17.7 30.2 44.6 66.5 90.3 120.8 276.2
2005 NA 0.0 17.9 30.5 45.2 67.4 92.4 126.3 307.5
* Total Tax Revenue and Individual Income Taxes given as percent of GDP
Source: Budget of the United States Government, FY 2009, Historical Tables,
tables 2.1, and 10.1;
Congressional Budget Office, Detailed Tables for 1979 to 2005
Notes from Congressional Budget Office tables:
Effective tax rates are calculated by dividing taxes by comprehensive household income.
Comprehensive household income equals pretax cash income plus income from other sources. Pretax cash income is the sum of wages, salaries, self-employment income, rents, taxable and nontaxable interest, dividends, realized capital gains, cash transfer payments, and retirement benefits plus taxes paid by businesses (corporate income taxes and the employer's share of Social Security, Medicare, and federal unemployment insurance payroll taxes) and employee contributions to 401(k) retirement plans. Other sources of income include all in-kind benefits (Medicare, Medicaid, employer-paid health insurance premiums, food stamps, school lunches and breakfasts, housing assistance, and energy assistance). Households with negative income are excluded from the lowest income category but are included in totals.
Income categories are defined by ranking all people by their comprehensive household income adjusted for household size—that is, divided by the square root of the house- hold’s size. (A household consists of the people who share a housing unit, regardless of their relationships.) Quintiles, or fifths, contain equal numbers of people.
Individual income taxes are distributed directly to households paying those taxes. Social insurance, or payroll, taxes are distributed to households paying those taxes directly or paying them indirectly through their employers. Corporate income taxes are distributed to households according to their share of capital income. Federal excise taxes are distributed to them according to their consumption of the taxed good or service.
The minimum adjusted income is the lower income boundary for each quintile. Because incomes are adjusted by dividing income by the square root of household size, an adjusted income range implies different unadjusted income for different size households. To compute the unadjusted income range for a particular size household, the adjusted income must be multiplied by the square root of the household size: 1.414 for a two- person household, 1.732 for a three-person household; 2.0 for a four-person household, 2.236 for a five-person household. For example, in 2005, the highest quintile had adjusted income above $67,400. A two-person household would need income above $95,300 to fall in that quintile, while a four-person household would need income in excess of $134,800.