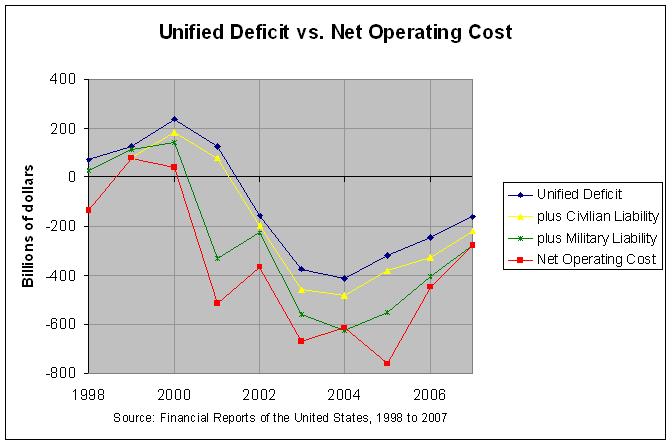
RECONCILIATION OF THE NET OPERATING COST AND THE UNIFIED BUDGET DEFICIT (billions of dollars)
1997 1998 1999 2000 2001 2002 2003 2004 2005 2006 2007
------ ------ ------ ------ ------ ------ ------ ------ ------ ------ ------
Unified budget deficit.................... -21.9 69.2 124.4 236.9 127.0 -157.7 -374.8 -412.3 -318.5 -247.7 -162.8
Change in:
Liability for civilian employee benefits -39.8 -41.6 -55.2 -50.1 -38.9 -83.9 -68.7 -62.3 -81.3 -55.9
Liability for military employee benefits 31.1 -39.6 -406.8 -32.4 -101.1 -143.4 -169.6 -74.9 -60.3
Liability for veteran's compensation.... -109.4 94.9 -69.4 -139.3 -157.3 -105.6 30.0 -197.8 -31.2 26.1
Environmental liabilities............... -12.8 -88.7 -19.6 -5.7 33.8 23.1 0.7 -10.6 -45.4 -36.8
Depreciation expense...................... -17.3 -15.4 -21.4 -20.5 -71.2 -89.9 -79.7 -82.9 -45.3
Total Capitalized Fixed Assets............ 41.5 31.6 34.4 40.9 102.0 112.1 53.4 103.7 58.8
All Other Reconciling Items............... 19.3 -41.0 -67.4 -29.7 -52.9 -32.8 -56.1 -44.1 24.9 10.2 0.7
------ ------ ------ ------ ------ ------ ------ ------ ------ ------ ------
Net operating cost........................ -2.6 -133.8 76.9 39.6 -514.8 -364.9 -667.6 -615.6 -760.2 -449.5 -275.5
CHANGE IN NET POSITION (billions of dollars)
1997 1998 1999 2000 2001 2002 2003 2004 2005 2006 2007
------ ------ ------ ------ ------ ------ ------ ------ ------ ------ ------
Net position, beginning of period....... -5003.0 -6134.4 -6026.2 -5945.4 -6458.8 -6820.2 -7094.2 -7709.8 -8466.9 -8916.4
Change in accounting principle.......... -681.7 383.1 -13.9
Other adjustments....................... -315.9 31.3 41.2 1.4 3.5 10.5 3.1
Net operating cost...................... -2.6 -133.8 76.9 39.6 -514.8 -364.9 -667.6 -615.6 -760.2 -449.5 -275.5
------ ------ ------ ------ ------ ------ ------ ------ ------ ------ ------
Net position, end of period............. -5003.0 -6134.4 -6026.2 -5945.4 -6458.8 -6820.2 -7094.2 -7709.8 -8466.9 -8916.4 -9205.8
Gross Federal Debt...................... 5369.2 5478.2 5605.5 5628.7 5769.9 6198.4 6760.0 7354.7 7905.3 8451.4 8950.7
Debt Held by the Public................. 3772.3 3721.1 3632.4 3409.8 3319.6 3540.4 3913.4 4295.5 4592.2 4829.0 5035.1
Gross Domestic Product (GDP)............ 8182.4 8627.9 9125.3 9709.8 10057.9 10377.4 10808.6 11499.9 12237.9 13015.5 13667.5
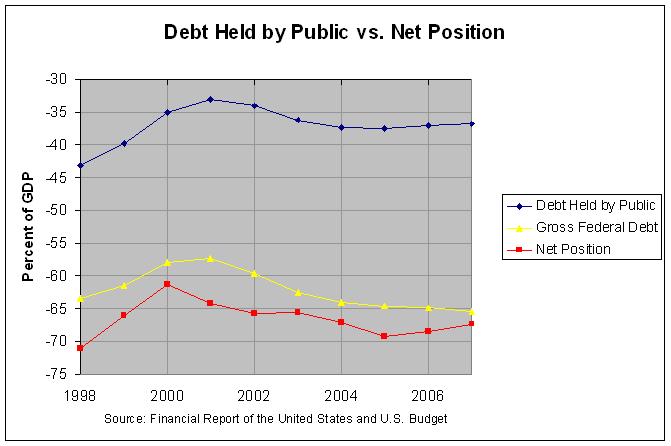
CHANGE IN NET POSITION (percent of GDP)
1997 1998 1999 2000 2001 2002 2003 2004 2005 2006 2007
------ ------ ------ ------ ------ ------ ------ ------ ------ ------ ------
Net position, beginning of period....... -58.0 -67.2 -62.1 -59.1 -62.2 -63.1 -61.7 -63.0 -65.1 -65.2
Change in accounting principle.......... -7.9 3.5 -0.1
Other adjustments....................... -3.7 0.3 0.4 0.0 0.0 0.1 0.0
Net operating cost...................... 0.0 -1.6 0.8 0.4 -5.1 -3.5 -6.2 -5.4 -6.2 -3.5 -2.0
------ ------ ------ ------ ------ ------ ------ ------ ------ ------ ------
Net position, end of period............. -61.1 -71.1 -66.0 -61.2 -64.2 -65.7 -65.6 -67.0 -69.2 -68.5 -67.4
Debt Held by the Public................. -46.1 -43.1 -39.8 -35.1 -33.0 -34.1 -36.2 -37.4 -37.5 -37.1 -36.8
Gross Federal Debt...................... -65.6 -63.5 -61.4 -58.0 -57.4 -59.7 -62.5 -64.0 -64.6 -64.9 -65.5
Fiscal Year from which data was obtained 1997 1998 1999 2001 2002 2003 2004 2005 2006 2007 2007
Source: Financial Report of the United States, Fiscal Years 1997, 1998, 1999, 2000, 2001, 2002, 2003, 2004, 2005, 2006, and 2007;
Budget of the United States Government, FY 2009: Historical Tables, tables 7.1 and 10.1
========================================================================================
SOCIAL INSURANCE EXPOSURES (billions of dollars)
2003 2004 2005 2006 2007
------ ------ ------ ------ ------
Social Insurance Exposures (not included on the balance sheets)
Closed Group (current participants)....... -26857 -37278 -40039 -44145 -45062
Open Group (current + future participants) -20825 -33363 -35689 -38851 -40948
Note: Social Insurance includes Social Security, Medicare, Railroad Retirement, and Black Lung
Source: Financial Report of the United States for Fiscal Year 2007
Go to Budget Home Page
