U.S. INTERNATIONAL TRADE IN GOODS AND SERVICES - monthly values
(billions of dollars, seasonally adjusted)
Balance Exports Imports
---------------------- ---------------------- ----------------------
Year Mon Total Goods Srvcs Total Goods Srvcs Total Goods Srvcs
---- --- ------ ------ ------ ------ ------ ------ ------ ------ ------
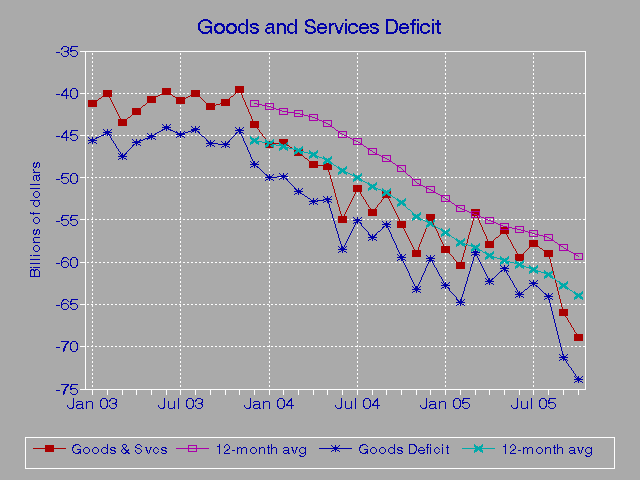
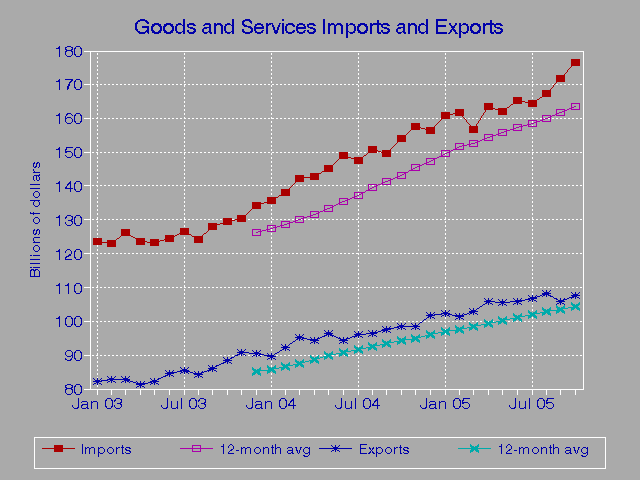
2003 Jan -41.22 -45.64 4.42 82.44 57.31 25.14 123.66 102.95 20.72
Feb -40.07 -44.68 4.60 82.94 57.79 25.15 123.01 102.47 20.55
Mar -43.54 -47.55 4.00 82.86 58.07 24.79 126.40 105.61 20.79
Apr -42.18 -45.88 3.70 81.38 57.40 23.98 123.55 103.28 20.27
May -40.79 -45.15 4.36 82.40 57.63 24.77 123.19 102.78 20.41
Jun -39.88 -44.04 4.16 84.71 59.66 25.04 124.59 103.70 20.89
Jul -40.93 -44.89 3.96 85.58 59.96 25.62 126.51 104.85 21.66
Aug -40.13 -44.37 4.25 84.28 58.28 25.99 124.40 102.65 21.75
Sep -41.65 -46.03 4.39 86.21 59.95 26.26 127.85 105.98 21.87
Oct -41.13 -46.08 4.96 88.45 61.17 27.28 129.57 107.25 22.32
Nov -39.56 -44.47 4.91 90.76 63.44 27.32 130.32 107.91 22.41
Dec -43.74 -48.53 4.79 90.57 62.76 27.81 134.32 111.29 23.02
2004 Jan -46.05 -49.94 3.89 89.53 62.18 27.35 135.58 112.12 23.46
Feb -45.83 -49.86 4.02 92.39 64.80 27.59 138.22 114.66 23.57
Mar -46.97 -51.66 4.69 95.17 66.81 28.37 142.14 118.46 23.68
Apr -48.41 -52.82 4.41 94.45 66.12 28.34 142.86 118.93 23.93
May -48.74 -52.58 3.84 96.40 68.18 28.22 145.14 120.76 24.38
Jun -54.89 -58.59 3.70 94.25 65.78 28.47 149.14 124.37 24.77
Jul -51.33 -55.05 3.71 96.19 67.75 28.44 147.52 122.80 24.73
Aug -54.20 -57.10 2.91 96.51 68.06 28.45 150.71 125.16 25.54
Sep -51.94 -55.63 3.69 97.67 68.99 28.68 149.61 124.62 24.99
Oct -55.57 -59.43 3.86 98.52 69.26 29.26 154.10 128.69 25.41
Nov -58.98 -63.23 4.25 98.64 68.61 30.03 157.62 131.84 25.78
Dec -54.67 -59.51 4.84 101.72 71.00 30.72 156.39 130.52 25.88
2005 Jan -58.58 -62.70 4.12 102.22 71.59 30.63 160.80 134.29 26.51
Feb -60.42 -64.74 4.32 101.41 70.72 30.69 161.83 135.46 26.37
Mar -54.06 -58.89 4.84 102.82 71.53 31.29 156.88 130.43 26.45
Apr -57.91 -62.32 4.41 105.72 74.55 31.17 163.63 136.87 26.76
May -56.26 -60.78 4.52 105.70 74.47 31.23 161.96 135.26 26.71
Jun -59.42 -63.83 4.41 105.85 74.51 31.34 165.27 138.34 26.93
Jul -57.82 -62.54 4.72 106.67 75.07 31.60 164.48 137.61 26.88
Aug -58.99 -64.06 5.08 108.33 76.70 31.62 167.31 140.77 26.55
Sep -66.00 -71.32 5.33 105.77 73.46 32.32 171.77 144.78 26.99
Oct -68.89 -73.88 5.00 107.55 75.25 32.30 176.43 149.13 27.30
--------------------------------------------------------------------------------
U.S. INTERNATIONAL TRADE IN GOODS AND SERVICES - 12 month trailing totals
(billions of dollars, seasonally adjusted)
Balance Exports Imports
---------------------- ---------------------- ----------------------
Year Mon Total Goods Srvcs Total Goods Srvcs Total Goods Srvcs
---- --- ------ ------ ------ ------ ------ ------ ------ ------ ------
2003 Dec -494.81 -547.30 52.48 1022.57 713.42 309.15 1517.38 1260.72 256.66
2004 Jan -499.65 -551.59 51.95 1029.66 718.30 311.36 1529.30 1269.90 259.41
Feb -505.41 -556.78 51.37 1039.11 725.31 313.80 1544.51 1282.08 262.43
Mar -508.83 -560.89 52.06 1051.42 734.04 317.37 1560.25 1294.93 265.32
Apr -515.06 -567.82 52.76 1064.49 742.76 321.74 1579.55 1310.58 268.97
May -523.01 -575.26 52.25 1078.49 753.30 325.19 1601.50 1328.56 272.94
Jun -538.02 -589.81 51.78 1088.04 759.42 328.62 1626.06 1349.23 276.83
Jul -548.42 -599.96 51.54 1098.65 767.22 331.43 1647.07 1367.18 279.89
Aug -562.49 -612.69 50.20 1110.88 776.99 333.89 1673.38 1389.69 283.69
Sep -572.79 -622.29 49.50 1122.34 786.04 336.31 1695.13 1408.33 286.81
Oct -587.24 -635.64 48.41 1132.42 794.13 338.29 1719.66 1429.77 289.89
Nov -606.65 -654.41 47.75 1140.30 799.30 341.00 1746.95 1453.71 293.25
Dec -617.58 -665.39 47.81 1151.45 807.54 343.91 1769.03 1472.93 296.11
2005 Jan -630.11 -678.15 48.04 1164.14 816.94 347.19 1794.24 1495.09 299.15
Feb -644.69 -693.03 48.34 1173.15 822.86 350.29 1817.85 1515.89 301.95
Mar -651.78 -700.27 48.49 1180.80 827.59 353.21 1832.58 1527.86 304.73
Apr -661.29 -709.77 48.48 1192.07 836.02 356.04 1853.36 1545.79 307.56
May -668.81 -717.97 49.16 1201.37 842.32 359.05 1870.18 1560.29 309.89
Jun -673.34 -723.21 49.87 1212.97 851.05 361.91 1886.31 1574.27 312.04
Jul -679.82 -730.71 50.88 1223.44 858.37 365.08 1903.27 1589.07 314.19
Aug -684.61 -737.67 53.05 1235.26 867.01 368.25 1919.87 1604.68 315.20
Sep -698.67 -753.36 54.69 1243.36 871.48 371.88 1942.03 1624.84 317.19
Oct -711.98 -767.81 55.83 1252.38 877.46 374.92 1964.37 1645.28 319.09
--------------------------------------------------------------------------------
U.S. INTERNATIONAL TRADE IN GOODS AND SERVICES - 12 month trailing averages
(billions of dollars, seasonally adjusted)
Balance Exports Imports
---------------------- ---------------------- ----------------------
Year Mon Total Goods Srvcs Total Goods Srvcs Total Goods Srvcs
---- --- ------ ------ ------ ------ ------ ------ ------ ------ ------
2003 Dec -41.23 -45.61 4.37 85.21 59.45 25.76 126.45 105.06 21.39
2004 Jan -41.64 -45.97 4.33 85.80 59.86 25.95 127.44 105.82 21.62
Feb -42.12 -46.40 4.28 86.59 60.44 26.15 128.71 106.84 21.87
Mar -42.40 -46.74 4.34 87.62 61.17 26.45 130.02 107.91 22.11
Apr -42.92 -47.32 4.40 88.71 61.90 26.81 131.63 109.22 22.41
May -43.58 -47.94 4.35 89.87 62.78 27.10 133.46 110.71 22.75
Jun -44.84 -49.15 4.32 90.67 63.29 27.38 135.50 112.44 23.07
Jul -45.70 -50.00 4.29 91.55 63.93 27.62 137.26 113.93 23.32
Aug -46.87 -51.06 4.18 92.57 64.75 27.82 139.45 115.81 23.64
Sep -47.73 -51.86 4.13 93.53 65.50 28.03 141.26 117.36 23.90
Oct -48.94 -52.97 4.03 94.37 66.18 28.19 143.30 119.15 24.16
Nov -50.55 -54.53 3.98 95.02 66.61 28.42 145.58 121.14 24.44
Dec -51.47 -55.45 3.98 95.95 67.29 28.66 147.42 122.74 24.68
2005 Jan -52.51 -56.51 4.00 97.01 68.08 28.93 149.52 124.59 24.93
Feb -53.72 -57.75 4.03 97.76 68.57 29.19 151.49 126.32 25.16
Mar -54.32 -58.36 4.04 98.40 68.97 29.43 152.72 127.32 25.39
Apr -55.11 -59.15 4.04 99.34 69.67 29.67 154.45 128.82 25.63
May -55.73 -59.83 4.10 100.11 70.19 29.92 155.85 130.02 25.82
Jun -56.11 -60.27 4.16 101.08 70.92 30.16 157.19 131.19 26.00
Jul -56.65 -60.89 4.24 101.95 71.53 30.42 158.61 132.42 26.18
Aug -57.05 -61.47 4.42 102.94 72.25 30.69 159.99 133.72 26.27
Sep -58.22 -62.78 4.56 103.61 72.62 30.99 161.84 135.40 26.43
Oct -59.33 -63.98 4.65 104.37 73.12 31.24 163.70 137.11 26.59
--------------------------------------------------------------------------------
Note: Data presented on a Balance of Payments (BOP) basis.
Source: Report FT900, Bureau of the Census, Foreign Trade Division, October 2005.
Foreign Imports, Exports, and Trade Balance: 1940-2004 (Annual Values)
Go to Budget Home Page
