IMF DATA FOR GDP GROWTH AND GOVERNMENT EXPENDITURES: 2006-2011
Gross domestic product, constant prices
Percent change (08+09) 09+10+11 Estimates
minus minus Start
Country 2006 2007 2008 2009 2010 2011 (06+07) 06+07+08 After
---------------- ------- -------- -------- -------- -------- -------- -------- -------- --------
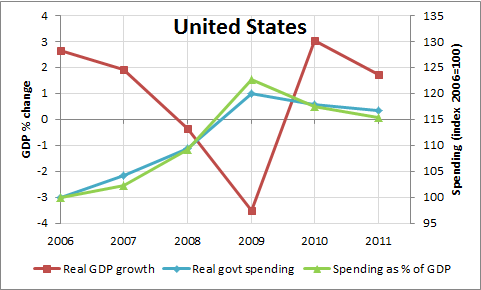
United States 2.658 1.913 -0.337 -3.486 3.030 1.735 -8.4 -3.0 2011
Japan 1.693 2.192 -1.042 -5.527 4.435 -0.748 -10.5 -4.7 2011
Germany 3.889 3.394 0.809 -5.078 3.562 3.056 -11.6 -6.6 2011
France 2.658 2.234 -0.196 -2.631 1.382 1.715 -7.7 -4.2 2011
United Kingdom 2.607 3.466 -1.103 -4.373 2.092 0.655 -11.5 -6.6 2011
Italy 2.199 1.683 -1.156 -5.494 1.804 0.431 -10.5 -6.0 2011
Canada 2.823 2.200 0.689 -2.770 3.215 2.460 -7.1 -2.8 2011
Australia 2.682 4.676 2.500 1.373 2.544 2.035 -3.5 -3.9 2011
Spain 4.077 3.479 0.888 -3.740 -0.070 0.710 -10.4 -11.5 2010
Mexico 5.147 3.242 1.186 -6.275 5.543 3.967 -13.5 -6.3 2010
Korea 5.179 5.106 2.298 0.319 6.320 3.634 -7.7 -2.3 2010
Turkey 6.893 4.669 0.659 -4.826 9.006 8.460 -15.7 0.4 2010
Netherlands 3.394 3.921 1.804 -3.479 1.633 1.266 -9.0 -9.7 2011
Switzerland 3.630 3.645 2.095 -1.878 2.714 1.851 -7.1 -6.7 2011
Sweden 4.557 3.431 -0.774 -4.845 5.845 3.991 -13.6 -2.2 2011
Poland 6.227 6.785 5.127 1.606 3.944 4.350 -6.3 -8.2 2011
Norway 2.443 2.652 0.009 -1.661 0.654 1.688 -6.7 -4.4 2011
Belgium 2.702 2.900 0.957 -2.841 2.266 1.893 -7.5 -5.2 2011
Austria 3.670 3.706 1.396 -3.810 2.315 3.107 -9.8 -7.2 2011
Denmark 3.395 1.583 -0.784 -5.834 1.296 1.050 -11.6 -7.7 2011
Chile 5.825 5.207 3.034 -0.860 6.137 5.924 -8.9 -2.9 2011
Greece 4.614 3.032 -0.137 -3.258 -3.507 -6.860 -11.0 -21.1 2010
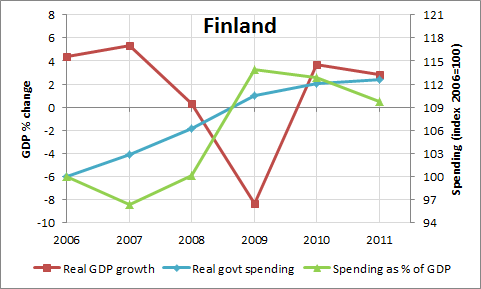
Finland 4.411 5.335 0.294 -8.354 3.732 2.855 -17.8 -11.8 2011
Israel 5.594 5.497 4.028 0.837 4.846 4.707 -6.2 -4.7 2011
Portugal 1.448 2.365 -0.008 -2.908 1.383 -1.466 -6.7 -6.8 2010
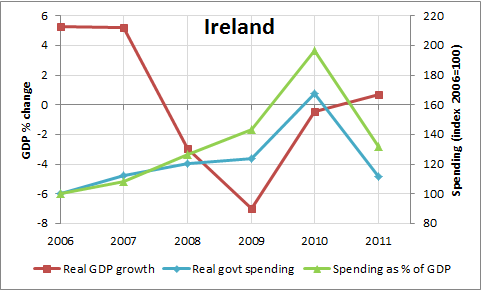
Ireland 5.312 5.182 -2.972 -6.995 -0.430 0.705 -20.5 -14.2 2011
Czech Republic 7.020 5.735 3.099 -4.695 2.739 1.655 -14.4 -16.2 2011
New Zealand 0.997 2.840 -0.074 -2.071 1.215 1.441 -6.0 -3.2 2011
Hungary 3.900 0.100 0.900 -6.800 1.270 1.695 -9.9 -8.7 2011
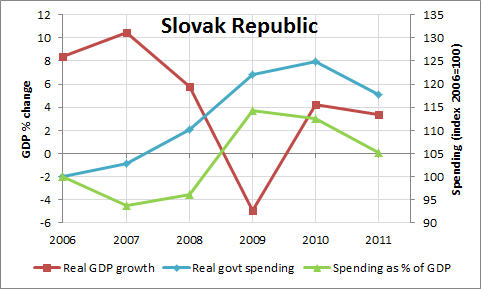
Slovak Republic 8.345 10.494 5.751 -4.932 4.183 3.349 -18.0 -22.0 2011
Luxembourg 4.969 6.639 0.754 -5.300 2.678 1.004 -16.2 -14.0 2011
Slovenia 5.850 6.870 3.589 -8.008 1.380 -0.175 -17.1 -23.1 2011
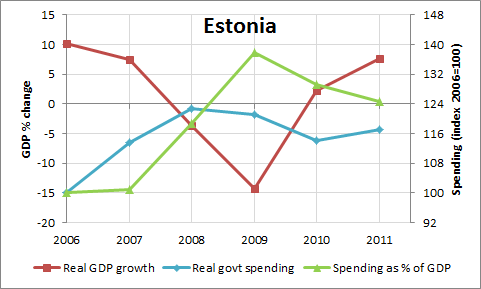
Estonia 10.097 7.492 -3.671 -14.258 2.264 7.636 -35.5 -18.3 2011
Iceland 4.709 5.985 1.270 -6.807 -4.024 3.051 -16.2 -19.7 2011
General government total expenditure
Percent of GDP 2009 2011 Estimates
minus minus Start
Country 2006 2007 2008 2009 2010 2011 2007 2007 After
---------------- ------- -------- -------- -------- -------- -------- -------- -------- --------
United States 35.852 36.672 39.196 43.981 42.142 41.397 7.3 4.7 2010
Japan 34.489 33.312 35.730 39.982 39.002 40.675 6.7 7.4 2010
Germany 45.559 43.506 44.046 48.104 47.869 45.625 4.6 2.1 2011
France 52.934 52.595 53.329 56.725 56.668 56.321 4.1 3.7 2010
United Kingdom 40.613 40.325 43.066 47.267 46.325 45.725 6.9 5.4 2010
Italy 48.464 47.611 48.610 51.889 50.495 49.953 4.3 2.3 2011
Canada 39.268 39.158 39.535 44.056 43.815 42.664 4.9 3.5 2011
Australia 34.635 34.244 34.487 37.579 36.773 36.598 3.3 2.4 2011
Spain 38.342 39.192 41.300 46.065 45.439 43.586 6.9 4.4 2011
Mexico 22.818 23.148 24.606 28.314 26.928 26.211 5.2 3.1 2010
Korea 21.535 21.886 22.387 23.030 20.999 21.658 1.1 -0.2 2010
Turkey 32.793 33.325 33.837 37.717 35.443 34.186 4.4 0.9 2010
Netherlands 45.687 45.087 46.116 50.785 50.614 50.034 5.7 4.9 2011
Switzerland 35.663 34.634 32.612 34.398 34.040 34.736 -0.2 0.1 2009
Sweden 50.770 48.968 49.625 52.793 50.634 49.126 3.8 0.2 2010
Poland 43.864 42.187 43.194 44.510 45.366 44.472 2.3 2.3 2011
Norway 39.936 40.386 39.764 46.610 45.421 44.320 6.2 3.9 2010
Belgium 48.603 48.320 49.900 53.828 52.942 53.450 5.5 5.1 2011
Austria 49.141 48.602 49.335 52.893 52.603 50.449 4.3 1.8 2011
Denmark 51.250 50.788 51.424 57.899 56.174 55.972 7.1 5.2 2010
Chile 18.716 19.381 21.727 24.622 23.628 23.300 5.2 3.9 2011
Greece 44.691 46.709 49.734 53.033 49.620 49.696 6.3 3.0 2010
Finland 49.238 47.431 49.316 56.103 55.550 54.043 8.7 6.6 2010
Israel 47.501 46.016 45.427 45.086 44.736 44.354 -0.9 -1.7 2010
Portugal 44.364 44.362 44.816 49.914 51.414 48.710 5.6 4.3 2010
Ireland 33.406 36.194 42.301 47.937 65.637 44.143 11.7 7.9 2011
Czech Republic 41.967 41.040 41.148 44.921 44.110 44.549 3.9 3.5 2010
New Zealand 31.105 31.064 32.862 34.471 34.490 35.364 3.4 4.3 2011
Hungary 52.164 50.641 49.205 51.380 49.453 48.441 0.7 -2.2 2010
Slovak Republic 36.521 34.210 35.049 41.704 41.100 38.375 7.5 4.2 2011
Luxembourg 38.576 36.267 37.103 43.042 42.482 41.635 6.8 5.4 2011
Slovenia 42.547 40.262 41.422 46.355 47.134 47.713 6.1 7.5 2011
Estonia 34.573 34.853 41.037 47.654 44.713 43.123 12.8 8.3 2011
Iceland 41.641 42.268 44.639 49.672 47.923 46.321 7.4 4.1 2011
General government total expenditure
Percent of GDP (index 2006=100) 2009 2011 Estimates
minus minus Start
Country 2006 2007 2008 2009 2010 2011 2007 2007 After
---------------- ------- -------- -------- -------- -------- -------- -------- -------- --------
United States 100.0 102.3 109.3 122.7 117.5 115.5 20.4 13.2 2010
Japan 100.0 96.6 103.6 115.9 113.1 117.9 19.3 21.3 2010
Germany 100.0 95.5 96.7 105.6 105.1 100.1 10.1 4.7 2011
France 100.0 99.4 100.7 107.2 107.1 106.4 7.8 7.0 2010
United Kingdom 100.0 99.3 106.0 116.4 114.1 112.6 17.1 13.3 2010
Italy 100.0 98.2 100.3 107.1 104.2 103.1 8.8 4.8 2011
Canada 100.0 99.7 100.7 112.2 111.6 108.6 12.5 8.9 2011
Australia 100.0 98.9 99.6 108.5 106.2 105.7 9.6 6.8 2011
Spain 100.0 102.2 107.7 120.1 118.5 113.7 17.9 11.5 2011
Mexico 100.0 101.4 107.8 124.1 118.0 114.9 22.6 13.4 2010
Korea 100.0 101.6 104.0 106.9 97.5 100.6 5.3 -1.1 2010
Turkey 100.0 101.6 103.2 115.0 108.1 104.2 13.4 2.6 2010
Netherlands 100.0 98.7 100.9 111.2 110.8 109.5 12.5 10.8 2011
Switzerland 100.0 97.1 91.4 96.5 95.4 97.4 -0.7 0.3 2009
Sweden 100.0 96.5 97.7 104.0 99.7 96.8 7.5 0.3 2010
Poland 100.0 96.2 98.5 101.5 103.4 101.4 5.3 5.2 2011
Norway 100.0 101.1 99.6 116.7 113.7 111.0 15.6 9.9 2010
Belgium 100.0 99.4 102.7 110.8 108.9 110.0 11.3 10.6 2011
Austria 100.0 98.9 100.4 107.6 107.0 102.7 8.7 3.8 2011
Denmark 100.0 99.1 100.3 113.0 109.6 109.2 13.9 10.1 2010
Chile 100.0 103.6 116.1 131.6 126.2 124.5 28.0 20.9 2011
Greece 100.0 104.5 111.3 118.7 111.0 111.2 14.2 6.7 2010
Finland 100.0 96.3 100.2 113.9 112.8 109.8 17.6 13.4 2010
Israel 100.0 96.9 95.6 94.9 94.2 93.4 -2.0 -3.5 2010
Portugal 100.0 100.0 101.0 112.5 115.9 109.8 12.5 9.8 2010
Ireland 100.0 108.3 126.6 143.5 196.5 132.1 35.2 23.8 2011
Czech Republic 100.0 97.8 98.0 107.0 105.1 106.2 9.2 8.4 2010
New Zealand 100.0 99.9 105.6 110.8 110.9 113.7 11.0 13.8 2011
Hungary 100.0 97.1 94.3 98.5 94.8 92.9 1.4 -4.2 2010
Slovak Republic 100.0 93.7 96.0 114.2 112.5 105.1 20.5 11.4 2011
Luxembourg 100.0 94.0 96.2 111.6 110.1 107.9 17.6 13.9 2011
Slovenia 100.0 94.6 97.4 109.0 110.8 112.1 14.3 17.5 2011
Estonia 100.0 100.8 118.7 137.8 129.3 124.7 37.0 23.9 2011
Iceland 100.0 101.5 107.2 119.3 115.1 111.2 17.8 9.7 2011
General government total expenditure
National currency (index 2006=100) 2009 2011 Estimates
minus minus Start
Country 2006 2007 2008 2009 2010 2011 2007 2007 After
---------------- ------- -------- -------- -------- -------- -------- -------- -------- --------
United States 100.0 107.3 116.8 127.8 127.6 130.3 20.6 23.0 2010
Japan 100.0 97.8 102.5 107.8 107.5 109.0 10.0 11.2 2010
Germany 100.0 100.2 103.4 108.4 112.5 111.3 8.1 11.0 2011
France 100.0 104.2 108.1 112.5 114.9 118.0 8.3 13.8 2010
United Kingdom 100.0 105.1 114.4 122.1 125.7 127.8 17.0 22.7 2010
Italy 100.0 102.3 105.8 109.0 108.4 109.1 6.7 6.8 2011
Canada 100.0 105.2 111.3 118.3 125.0 128.7 13.1 23.6 2011
Australia 100.0 108.0 118.9 131.7 139.2 147.5 23.7 39.6 2011
Spain 100.0 109.2 118.9 127.7 126.4 123.8 18.5 14.6 2011
Mexico 100.0 110.6 126.6 142.5 148.8 158.9 31.9 48.2 2010
Korea 100.0 109.0 117.4 125.3 125.9 136.9 16.3 27.9 2010
Turkey 100.0 113.0 129.3 144.5 157.3 179.3 31.5 66.3 2010
Netherlands 100.0 104.5 111.1 117.6 120.7 122.4 13.1 18.0 2011
Switzerland 100.0 103.2 101.6 105.3 107.1 112.2 2.2 9.0 2009
Sweden 100.0 102.4 106.4 109.7 112.8 114.9 7.3 12.5 2010
Poland 100.0 106.8 118.5 128.6 138.1 145.6 21.8 38.9 2011
Norway 100.0 107.0 116.9 126.1 131.6 137.9 19.2 31.0 2010
Belgium 100.0 104.7 111.5 118.3 121.1 127.3 13.6 22.6 2011
Austria 100.0 104.6 109.6 114.2 118.3 119.4 9.6 14.8 2011
Denmark 100.0 103.0 107.8 115.5 117.9 119.7 12.5 16.8 2010
Chile 100.0 114.1 132.7 155.0 169.7 182.4 41.0 68.3 2011
Greece 100.0 112.3 124.8 132.0 120.9 114.6 19.7 2.3 2010
Finland 100.0 104.5 112.2 118.6 122.3 126.8 14.1 22.3 2010
Israel 100.0 102.6 106.7 112.2 118.1 125.2 9.6 22.6 2010
Portugal 100.0 105.3 108.0 117.9 124.3 117.2 12.6 11.9 2010
Ireland 100.0 115.4 127.8 129.3 171.9 115.9 13.8 0.5 2011
Czech Republic 100.0 106.8 112.5 119.4 118.4 120.6 12.6 13.8 2010
New Zealand 100.0 107.4 117.1 123.9 130.3 140.0 16.5 32.6 2011
Hungary 100.0 102.5 105.8 106.6 107.1 110.4 4.1 8.0 2010
Slovak Republic 100.0 104.6 116.6 130.4 134.5 131.9 25.7 27.3 2011
Luxembourg 100.0 103.9 111.8 123.0 130.7 133.6 19.1 29.7 2011
Slovenia 100.0 105.3 116.9 123.9 126.4 128.7 18.6 23.4 2011
Estonia 100.0 121.0 144.5 142.4 138.1 148.8 21.5 27.8 2011
Iceland 100.0 113.7 135.9 152.6 151.1 155.2 39.0 41.5 2011
General government total expenditure
Constant national currency* (index 2006=100) 2009 2011 Estimates
minus minus Start
Country 2006 2007 2008 2009 2010 2011 2007 2007 After
---------------- ------- -------- -------- -------- -------- -------- -------- -------- --------
United States 100.0 104.3 109.4 120.1 118.0 116.7 15.8 12.5 2010
Japan 100.0 97.7 101.0 107.7 108.2 110.1 10.0 12.3 2010
Germany 100.0 98.0 98.3 102.9 105.6 101.9 4.9 3.9 2011
France 100.0 102.6 103.2 107.2 107.6 108.0 4.7 5.5 2010
United Kingdom 100.0 102.7 107.9 112.7 112.3 109.3 10.1 6.6 2010
Italy 100.0 100.2 100.2 102.4 100.2 98.0 2.2 -2.2 2011
Canada 100.0 103.0 106.4 112.8 117.1 117.2 9.8 14.3 2011
Australia 100.0 105.5 111.3 121.1 124.5 127.6 15.6 22.1 2011
Spain 100.0 106.2 111.0 119.6 116.0 110.2 13.4 4.0 2011
Mexico 100.0 106.4 115.8 123.8 124.2 128.2 17.4 21.7 2010
Korea 100.0 106.3 109.4 113.6 110.9 115.9 7.3 9.6 2010
Turkey 100.0 103.9 107.7 113.2 113.5 121.5 9.3 17.7 2010
Netherlands 100.0 102.8 107.0 112.2 114.0 112.9 9.3 10.1 2011
Switzerland 100.0 102.4 98.5 102.6 103.6 108.2 0.1 5.8 2009
Sweden 100.0 100.7 101.3 102.4 103.3 103.8 1.7 3.1 2010
Poland 100.0 104.2 110.9 116.4 121.9 123.3 12.2 19.1 2011
Norway 100.0 106.2 111.8 118.1 120.3 124.5 11.9 18.3 2010
Belgium 100.0 102.8 104.8 111.2 111.3 113.0 8.4 10.2 2011
Austria 100.0 102.4 103.9 107.8 109.8 107.0 5.4 4.6 2011
Denmark 100.0 101.2 102.5 108.4 108.1 106.9 7.1 5.7 2010
Chile 100.0 109.3 116.9 134.6 145.3 151.1 25.3 41.9 2011
Greece 100.0 109.1 116.2 121.3 106.2 97.6 12.3 -11.5 2010
Finland 100.0 102.9 106.3 110.5 112.1 112.5 7.7 9.7 2010
Israel 100.0 102.1 101.5 103.3 105.9 108.5 1.2 6.4 2010
Portugal 100.0 102.8 102.7 113.1 117.7 107.1 10.4 4.4 2010
Ireland 100.0 112.2 120.6 124.0 167.5 111.7 11.7 -0.5 2011
Czech Republic 100.0 103.9 102.9 108.0 105.6 105.5 4.2 1.7 2010
New Zealand 100.0 104.9 110.0 114.0 117.2 121.1 9.1 16.1 2011
Hungary 100.0 94.9 92.4 89.4 85.6 85.0 -5.6 -10.0 2010
Slovak Republic 100.0 102.7 110.1 122.0 125.0 117.8 19.3 15.1 2011
Luxembourg 100.0 101.6 105.7 115.8 120.4 118.9 14.3 17.4 2011
Slovenia 100.0 101.7 106.8 112.2 112.4 112.4 10.6 10.8 2011
Estonia 100.0 113.5 122.8 121.2 114.2 117.0 7.7 3.5 2011
Iceland 100.0 108.2 115.2 115.4 108.4 107.1 7.2 -1.2 2011
* Constant national currency = National currency adjusted by Inflation, average consumer prices
Source: World Economic Outlook Database, April 17, 2012
Go to Budget Home Page
