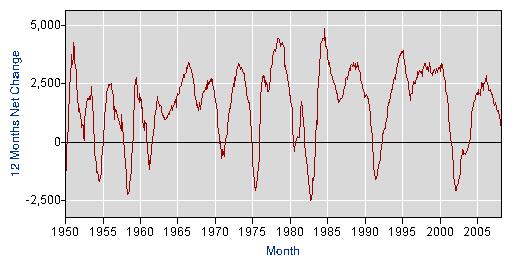
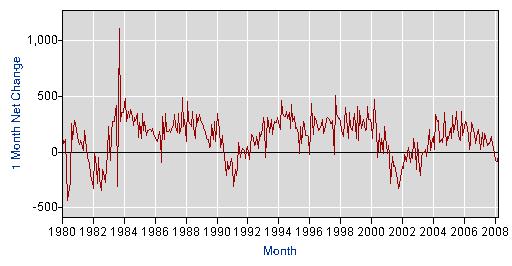
12-Month Growth in Total Nonfarm Employment, Seasonally Adjusted (in thousands) Monthly Growth in Total Nonfarm Employment, Seasonally Adjusted (in thousands)
 Monthly Growth in Total Nonfarm Employment, Seasonally Adjusted: 1980-2008
                         (thousands of employees)

Year   Jan   Feb   Mar   Apr   May   Jun   Jul   Aug   Sep   Oct   Nov   Dec
----  ----  ----  ----  ----  ----  ----  ----  ----  ----  ----  ----  ----
1980   131    79   112  -145  -431  -320  -263   260   113   280   256   195
1981    95    67   104    74    10   196   112   -36   -87  -100  -209  -278
1982  -327    -6  -129  -281   -45  -243  -343  -158  -181  -277  -124   -14
1983   225   -78   173   276   277   378   418  -308  1114   271   352   356
1984   447   479   275   363   308   379   312   241   311   286   349   127
1985   266   124   346   195   274   145   189   193   204   187   209   168
1986   123   107    93   188   125   -93   318   113   346   187   186   204
1987   171   232   249   338   227   171   346   170   229   492   231   294
1988    94   452   276   245   227   363   223   121   340   268   339   289
1989   262   258   192   173   118   117    39    47   249   111   277    95
1990   342   245   215    40   149    17   -42  -208   -82  -161  -144   -60
1991  -119  -306  -160  -211  -128    87   -47    15    35    12   -58    23
1992    49   -66    50   158   126    60    71   141    35   177   140   211
1993   310   242   -51   309   265   173   295   161   241   277   261   308
1994   268   201   462   353   331   315   363   300   354   207   423   274
1995   321   209   222   162   -16   231    79   271   245   147   148   131
1996   -19   434   263   161   323   278   232   196   220   243   296   167
1997   230   301   312   291   256   253   283   -18   508   339   303   299
1998   270   189   144   277   401   212   119   352   218   193   284   342
1999   121   410   106   376   213   266   291   192   202   408   294   294
2000   249   121   472   286   225   -46   163     3   122   -11   231   138
2001   -16    61   -30  -281   -44  -128  -125  -160  -244  -325  -292  -178
2002  -132  -147   -24   -85    -7    45   -97   -16   -55   126     8  -156
2003    83  -158  -212   -49    -6    -2    25   -42   103   203    18   124
2004   142    27   334   270   282    89   112    83   176   359    63   144
2005   125   209   119   332   177   261   368   213   110   105   361   152
2006   232   273   259   147    22    94   262   191   165    73   182   199
2007   126    25   177    46   162   107    57    74    81   140    60    41
2008   -76   -83   -81*  -20*

* preliminary

Source: Bureau of Labor Statistics, Series CES0000000001,
        online at http://data.bls.gov/cgi-bin/surveymost?ce
Go to Related blog entry
Go to Budget Home Page