LONG-RUN BUDGET PROJECTIONS OF 2001 BUDGET POLICY: 1995-2075
(Percent of GDP)
----------------------------------------------------------------
1995 2000 2005 2010 2015 2020 2030 2040 2050 2060 2075
----------------------------------------------------------------
Discretionary Grows with Inflation
Receipts........... 18.5 20.4 19.4 19.1 19.2 19.3 19.5 19.7 19.9 19.9 20.0
Outlays............ 20.7 18.7 17.6 16.7 16.5 16.9 18.2 18.7 19.3 21.1 26.3
Discretionary.... 7.4 6.5 5.8 5.1 4.7 4.4 3.9 3.4 3.1 2.7 2.3
Mandatory........ 10.1 9.9 10.4 11.1 12.0 13.3 15.6 16.7 17.6 19.1 22.1
Social Security 4.6 4.2 4.3 4.5 5.0 5.7 6.7 6.8 6.9 7.2 7.4
Medicare....... 2.1 2.1 2.3 2.5 2.9 3.3 4.1 4.4 4.4 4.5 4.8
Medicaid....... 1.2 1.2 1.5 1.8 2.1 2.4 3.2 4.0 5.0 6.2 8.6
Other.......... 2.2 2.4 2.3 2.3 2.1 2.0 1.7 1.5 1.4 1.3 1.2
Net Interest..... 3.2 2.3 1.4 0.5 -0.3 -0.9 -1.4 -1.4 -1.3 -0.8 1.9
Surplus/Deficit.... -2.2 1.7 1.8 2.4 2.7 2.5 1.4 1.0 0.5 -1.1 -6.3
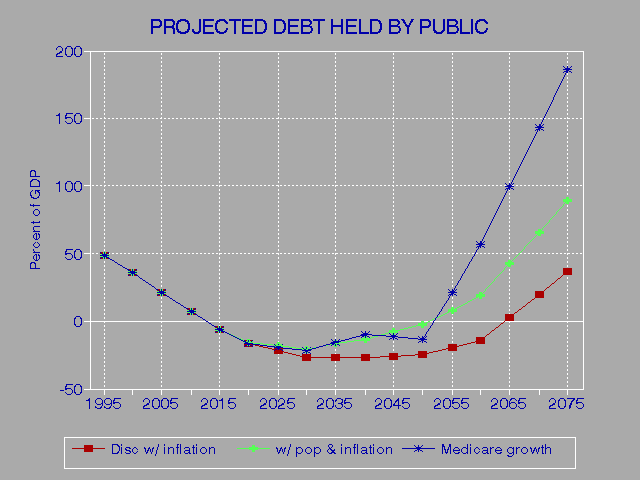
Public Debt........ 49.2 36.3 21.3 7.1 -6.3 -16.9 -26.9 -26.9 -24.5 -13.8 37.3
Primary Surplus/Def 0.9 4.0 3.1 2.9 2.5 1.6 0.0 -0.5 -0.8 -2.0 -4.5
----------------------------------------------------------------
1995 2000 2005 2010 2015 2020 2030 2040 2050 2060 2075
----------------------------------------------------------------
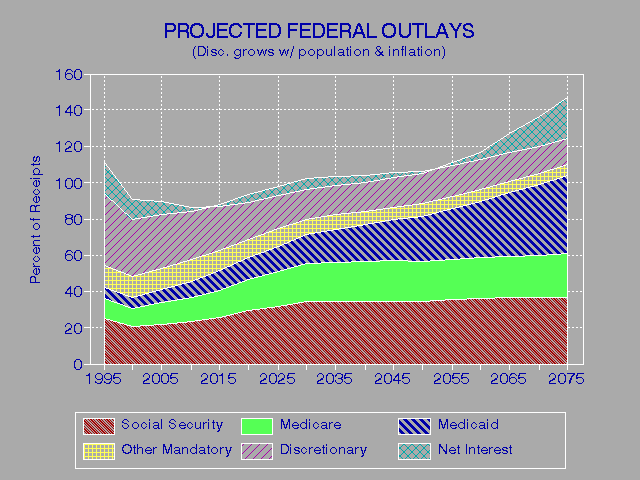
Discretionary Grows with Population and Inflation
Receipts........... 18.5 20.4 19.4 19.1 19.2 19.3 19.5 19.7 19.9 19.9 20.0
Outlays............ 20.7 18.7 17.6 16.7 16.6 17.3 18.9 20.0 21.1 23.3 29.6
Discretionary.... 7.4 6.5 5.8 5.1 4.9 4.7 4.4 4.0 3.6 3.3 2.9
Mandatory........ 10.1 9.9 10.4 11.1 12.0 13.3 15.6 16.7 17.6 19.1 22.1
Social Security 4.6 4.2 4.3 4.5 5.0 5.7 6.7 6.8 6.9 7.2 7.4
Medicare....... 2.1 2.1 2.3 2.5 2.9 3.3 4.1 4.4 4.4 4.5 4.8
Medicaid....... 1.2 1.2 1.5 1.8 2.1 2.4 3.2 4.0 5.0 6.2 8.6
Other.......... 2.2 2.4 2.3 2.3 2.1 2.0 1.7 1.5 1.4 1.3 1.2
Net Interest..... 3.2 2.3 1.4 0.5 -0.2 -0.8 -1.1 -0.7 -0.2 0.9 4.6
Surplus/Deficit.... -2.2 1.7 1.8 2.4 2.6 2.1 0.6 -0.3 -1.2 -3.4 -9.6
Public Debt........ 49.2 36.3 21.3 7.1 -5.8 -15.1 -20.3 -13.3 -2.3 18.8 89.0
Primary Surplus/Def 0.9 4.0 3.1 2.9 2.3 1.3 -0.5 -1.0 -1.4 -2.5 -5.0
----------------------------------------------------------------
1995 2000 2005 2010 2015 2020 2030 2040 2050 2060 2075
----------------------------------------------------------------
Continued Rapid Medicare Growth.
Receipts........... 18.5 20.4 19.4 19.1 19.2 19.3 19.5 19.7 19.9 19.9 20.0
Outlays............ 20.7 18.7 17.6 16.7 16.5 17.1 19.1 20.9 23.2 27.3 38.1
Discretionary.... 7.4 6.5 5.8 5.1 4.7 4.4 3.9 3.4 3.1 2.7 2.3
Mandatory........ 10.1 9.9 10.4 11.1 12.0 13.5 16.3 18.0 19.5 21.7 26.2
Social Security 4.6 4.2 4.3 4.5 5.0 5.7 6.7 6.8 6.9 7.2 7.4
Medicare....... 2.1 2.1 2.3 2.5 2.9 3.4 4.7 5.7 6.3 7.1 8.9
Medicaid....... 1.2 1.2 1.5 1.8 2.1 2.4 3.2 4.0 5.0 6.2 8.6
Other.......... 2.2 2.4 2.3 2.3 2.1 2.0 1.7 1.5 1.4 1.3 1.2
Net Interest..... 3.2 2.3 1.4 0.5 -0.3 -0.8 -1.2 -0.6 0.6 2.9 9.6
Surplus/Deficit.... -2.2 1.7 1.8 2.4 2.7 2.3 0.5 -1.2 -3.3 -7.4 -18.2
Public Debt........ 49.2 36.3 21.3 7.1 -6.3 -16.4 -21.6 -9.6 -13.5 56.5 186.0
Primary Surplus/Def 0.9 4.0 3.1 2.9 2.5 1.4 -0.7 -1.8 -2.7 -4.6 -8.6
====================================================================================
LONG-RUN BUDGET PROJECTIONS OF 2001 BUDGET POLICY: 1995-2075
(Percent of Receipts)
----------------------------------------------------------------
1995 2000 2005 2010 2015 2020 2030 2040 2050 2060 2075
----------------------------------------------------------------
Discretionary Grows with Inflation
Receipts.......... 100.0 100.0 100.0 100.0 100.0 100.0 100.0 100.0 100.0 100.0 100.0
Outlays........... 111.9 91.7 90.7 87.4 85.9 87.6 93.3 94.9 97.0 106.0 131.5
Discretionary.... 40.0 31.9 29.9 26.7 24.5 22.8 20.0 17.3 15.6 13.6 11.5
Mandatory........ 54.6 48.5 53.6 58.1 62.5 68.9 80.0 84.8 88.4 96.0 110.5
Social Security 24.9 20.6 22.2 23.6 26.0 29.5 34.4 34.5 34.7 36.2 37.0
Medicare....... 11.4 10.3 11.9 13.1 15.1 17.1 21.0 22.3 22.1 22.6 24.0
Medicaid....... 6.5 5.9 7.7 9.4 10.9 12.4 16.4 20.3 25.1 31.2 43.0
Other.......... 11.9 11.8 11.9 12.0 10.9 10.4 8.7 7.6 7.0 6.5 6.0
Net Interest..... 17.3 11.3 7.2 2.6 -1.6 -4.7 -7.2 -7.1 -6.5 -4.0 9.5
Surplus/Deficit... -11.9 8.3 9.3 12.6 14.1 13.0 7.2 5.1 2.5 -5.5 -31.5
Public Debt....... 265.9 177.9 109.8 37.2 -32.8 -87.6 -138 -137 -123 -69.3 186.5
Primary Surplus/Def 4.9 19.6 16.0 15.2 13.0 8.3 0.0 -2.5 -4.0 -10.1 -22.5
----------------------------------------------------------------
1995 2000 2005 2010 2015 2020 2030 2040 2050 2060 2075
----------------------------------------------------------------
Discretionary Grows with Population and Inflation
Receipts.......... 100.0 100.0 100.0 100.0 100.0 100.0 100.0 100.0 100.0 100.0 100.0
Outlays........... 111.9 91.7 90.7 87.4 86.5 89.6 96.9 101.5 106.0 117.1 148.0
Discretionary.... 40.0 31.9 29.9 26.7 25.5 24.4 22.6 20.3 18.1 16.6 14.5
Mandatory........ 54.6 48.5 53.6 58.1 62.5 68.9 80.0 84.8 88.4 96.0 110.5
Social Security 24.9 20.6 22.2 23.6 26.0 29.5 34.4 34.5 34.7 36.2 37.0
Medicare....... 11.4 10.3 11.9 13.1 15.1 17.1 21.0 22.3 22.1 22.6 24.0
Medicaid....... 6.5 5.9 7.7 9.4 10.9 12.4 16.4 20.3 25.1 31.2 43.0
Other.......... 11.9 11.8 11.9 12.0 10.9 10.4 8.7 7.6 7.0 6.5 6.0
Net Interest..... 17.3 11.3 7.2 2.6 -1.0 -4.1 -5.6 -3.6 -1.0 4.5 23.0
Surplus/Deficit... -11.9 8.3 9.3 12.6 13.5 10.9 3.1 -1.5 -6.0 -17.1 -48.0
Public Debt....... 265.9 177.9 109.8 37.2 -30.2 -78.2 -104 -67.5 -11.6 94.5 445.0
Primary Surplus/Def 4.9 19.6 16.0 15.2 12.0 6.7 -2.6 -5.1 -7.0 -12.6 -25.0
----------------------------------------------------------------
1995 2000 2005 2010 2015 2020 2030 2040 2050 2060 2075
----------------------------------------------------------------
Continued Rapid Medicare Growth.
Receipts.......... 100.0 100.0 100.0 100.0 100.0 100.0 100.0 100.0 100.0 100.0 100.0
Outlays........... 111.9 91.7 90.7 87.4 85.9 88.6 97.9 106.1 116.6 137.2 190.5
Discretionary.... 40.0 31.9 29.9 26.7 24.5 22.8 20.0 17.3 15.6 13.6 11.5
Mandatory........ 54.6 48.5 53.6 58.1 62.5 69.9 83.6 91.4 98.0 109.0 131.0
Social Security 24.9 20.6 22.2 23.6 26.0 29.5 34.4 34.5 34.7 36.2 37.0
Medicare....... 11.4 10.3 11.9 13.1 15.1 17.6 24.1 28.9 31.7 35.7 44.5
Medicaid....... 6.5 5.9 7.7 9.4 10.9 12.4 16.4 20.3 25.1 31.2 43.0
Other.......... 11.9 11.8 11.9 12.0 10.9 10.4 8.7 7.6 7.0 6.5 6.0
Net Interest..... 17.3 11.3 7.2 2.6 -1.6 -4.1 -6.2 -3.0 3.0 14.6 48.0
Surplus/Deficit... -11.9 8.3 9.3 12.6 14.1 11.9 2.6 -6.1 -16.6 -37.2 -91.0
Public Debt....... 265.9 177.9 109.8 37.2 -32.8 -85.0 -111 -48.7 -67.8 283.9 930.0
Primary Surplus/Def 4.9 19.6 16.0 15.2 13.0 7.3 -3.6 -9.1 -13.6 -23.1 -43.0
Note: In the graph of Projected Federal Outlays, net interest is projected to
be negative from 2014 through 2051. Hence, the upper line shows the
total of all outlays except net interest for these years and the line
just below it shows the total of all outlays.
Source: Budget of the United States Government, FY 2001, Analytical
Perspectives, page 30, Table 2-2
Go to Budget Home Page
