
       LONG-RUN BUDGET PROJECTIONS OF 2004 BUDGET POLICY: 2000-2080
                             (Percent of GDP)
                      -----------------------------------------------------
                       2000    2010    2020    2030    2040    2060    2080
                      -----------------------------------------------------
Discretionary Spending Grows with GDP
Receipts...........    20.8    18.4    18.8    19.0    19.0    19.2    19.3
Outlays............    18.4    19.6    21.0    24.4    27.8    36.7    52.7
  Discretionary....     6.3     6.5     6.0     6.0     6.0     6.0     6.0
  Mandatory........     9.8    11.3    13.2    15.5    16.8    19.0    22.8
    Social Security     4.2     4.3     5.3     6.2     6.4     6.6     7.1
    Medicare.......     2.0     2.6     3.4     4.6     5.5     7.0     9.3
    Medicaid.......     1.2     1.9     2.4     2.7     3.2     4.0     5.0
    Other..........     2.4     2.4     2.1     1.9     1.7     1.5     1.4
  Net Interest.....     2.3     1.8     1.8     2.9     5.0    11.7    23.9
Surplus/Deficit (-)     2.4    -1.2    -2.2    -5.4    -8.8   -17.5   -33.5
Primary Surplus/Def     4.7     0.6    -0.4    -2.5    -3.8    -5.8    -9.6
Public Debt........    35.1    35.7    35.1    56.7    98.4   229.4   466.1

===========================================================================
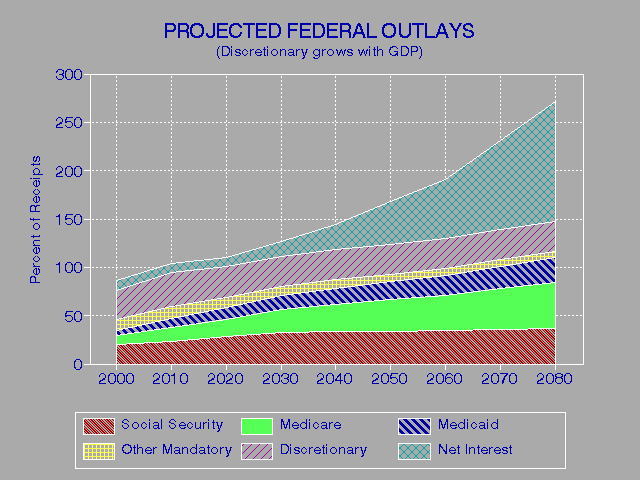
       LONG-RUN BUDGET PROJECTIONS OF 2004 BUDGET POLICY: 2000-2080
                           (Percent of Receipts)
                      -----------------------------------------------------
                       2000    2010    2020    2030    2040    2060    2080
                      -----------------------------------------------------
Discretionary Spending Grows with GDP
Receipts...........   100.0   100.0   100.0   100.0   100.0   100.0   100.0
Outlays............    88.5   106.5   111.7   128.4   146.3   191.1   273.1
  Discretionary....    30.3    35.3    31.9    31.6    31.6    31.3    31.1
  Mandatory........    47.1    61.4    70.2    81.6    88.4    99.0   118.1
    Social Security    20.2    23.4    28.2    32.6    33.7    34.4    36.8
    Medicare.......     9.6    14.1    18.1    24.2    28.9    36.5    48.2
    Medicaid.......     5.8    10.3    12.8    14.2    16.8    20.8    25.9
    Other..........    11.5    13.0    11.2    10.0     8.9     7.8     7.3
  Net Interest.....    11.1     9.8     9.6    15.3    26.3    60.9   123.8
Surplus/Deficit (-)    11.5    -6.5   -11.7   -28.4   -46.3   -91.1  -173.6
Primary Surplus/Def    22.6     3.3    -2.1   -13.2   -20.0   -30.2   -49.7
Public Debt........   168.8   194.0   186.7   298.4   517.9  1194.8  2415.0

================================================================================
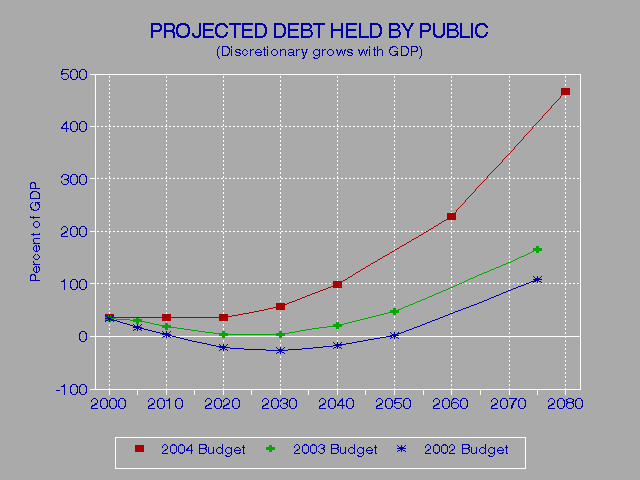
                    FEDERAL DEBT HELD BY THE PUBLIC
                            (Percent of GDP)
            --------------------------------------------------------------------
             2000   2005   2010   2020   2030   2040   2050   2060   2075   2080
            --------------------------------------------------------------------
2004 Budget  35.1          35.7   35.1   56.7   98.4         229.4         466.1
2003 Budget  35.0   29.2   19.1    2.9    4.4   20.9   46.5         165.2
2002 Budget  34.7   17.5    2.3  -21.8  -27.5  -17.8    1.3         108.0

================================================================================
     PERCENT CHANGE IN LONG-RUN BUDGET PROJECTIONS FROM 2003 TO 2004 BUDGET
                    ------------------------------------------------------------
                    2005   2010   2020   2030   2040   2050   2060   2075   2080
                    ------------------------------------------------------------
Discretionary Spending Grows with GDP
Receipts...........  2.1   -4.2   -2.1   -2.1   -2.1   -2.6   -2.0   -1.7   -1.5
Outlays............  1.6    8.9   14.1   19.6   24.7   32.7   32.7   48.9   53.3
  Discretionary.... -7.2    4.8    3.4    3.4    3.4    3.4    3.4    3.4    3.4
  Mandatory........  2.4    5.6    5.6    7.6    7.7    8.5    6.6   10.4   11.4
    Social Security  1.2   -2.3   -1.9   -1.6    0.0    1.6   -0.0    1.1    1.4
    Medicare.......  9.5   13.0   17.2   17.9   14.6   13.6    9.7   13.3   14.3
    Medicaid.......  3.3    5.6    9.1   12.5   18.5   20.0   23.5   31.9   34.4
    Other..........  0.0    4.3    5.0    5.6    0.0    0.0   -3.8   -5.0   -5.4
  Net Interest..... 28.1   63.6 1700.0 1350.0  455.6  317.5  189.6  193.7  194.3
Surplus/Deficit (-) 20.0 -200.0 -375.0  390.9  203.4  174.0  114.5  123.5  125.1
Primary Surplus/Def 26.2  -72.7 -144.4  177.8   90.0   71.4   40.8   41.8   42.0
Public Debt........ 21.2   86.9 1110.3 1188.6  370.8  252.5  144.1  146.3  146.7

Source: Budget of the United States Government, FY 2004,
        Analytical Perspectives, page 41, Table 3-2;
        Budget of the United States Government, FY 2003,
        Analytical Perspectives, page 45, Table 3-2;
        Budget of the United States Government, FY 2002,
        Analytical Perspectives, page 24, Table 2-2
Note: Table 3-2 is titled "LONG-RUN BUDGET PROJECTIONS OF 2003 BUDGET POLICY"
      in the 2004 Budget.  This is likely meant to be "2004 BUDGET POLICY" as
      the text states "The revenue projections in this section start with the
      budget's estimate of receipts under the Administration's proposals".
Go to Budget Home Page

