LONG-RUN BUDGET PROJECTIONS OF 2009 BUDGET POLICY: 1980-2080
(percent of GDP)
------------------------------------------------------------------------
1980 1990 2000 2010 2020 2030 2040 2060 2080
------------------------------------------------------------------------
Receipts........... 19.0 18.0 20.9 18.6 18.3 18.3 18.3 18.3 18.3
Outlays............ 21.7 21.8 18.4 19.6 18.0 19.8 21.4 24.6 29.2
Discretionary.... 10.1 8.7 6.3 7.0 4.7 4.7 4.7 4.7 4.7
Mandatory........ 9.6 9.9 9.8 10.8 12.1 14.0 15.0 15.8 16.7
Social Security 4.3 4.3 4.2 4.3 5.1 5.9 6.0 6.1 6.3
Medicare....... 1.1 1.7 2.0 2.7 3.1 4.1 4.8 5.3 5.3
Medicaid....... 0.5 0.7 1.2 1.5 1.9 2.3 2.7 3.2 3.9
Other.......... 3.7 3.2 2.4 2.4 2.0 1.7 1.5 1.3 1.2
Net Interest..... 1.9 3.2 2.3 1.8 1.2 1.0 1.7 4.1 7.8
Surplus/Deficit (-) -2.7 -3.9 2.4 -1.0 0.3 -1.5 -3.1 -6.3 -10.9
Primary Surplus/Def -0.8 -0.6 4.7 0.8 1.5 -0.4 -1.4 -2.3 -3.1
Debt Held by Public 26.1 42.0 35.1 38.2 22.2 20.5 33.9 80.4 154.4
Projections without Proposed Entitlement Savings:
Mandatory Outlays.. 9.6 9.9 9.8 10.9 12.4 14.8 16.2 18.1 20.0
Surplus/Deficit (-) -2.7 -3.9 2.4 -1.1 -0.1 -2.5 -5.2 -11.5 -20.6
Primary Surplus/Def -0.8 -0.6 4.7 0.6 1.2 -1.2 -2.6 -4.5 -6.4
Debt Held by Public 26.1 42.0 35.1 38.4 24.3 28.1 52.4 140.0 283.4
LONG-RUN BUDGET PROJECTIONS OF 2009 BUDGET POLICY: 1980-2080
(percent of receipts)
------------------------------------------------------------------------
1980 1990 2000 2010 2020 2030 2040 2060 2080
------------------------------------------------------------------------
Receipts........... 100.0 100.0 100.0 100.0 100.0 100.0 100.0 100.0 100.0
Outlays............ 114.2 121.1 88.0 105.4 98.4 108.2 116.9 134.4 159.6
Discretionary.... 53.2 48.3 30.1 37.6 25.7 25.7 25.7 25.7 25.7
Mandatory........ 50.5 55.0 46.9 58.1 66.1 76.5 82.0 86.3 91.3
Social Security 22.6 23.9 20.1 23.1 27.9 32.2 32.8 33.3 34.4
Medicare....... 5.8 9.4 9.6 14.5 16.9 22.4 26.2 29.0 29.0
Medicaid....... 2.6 3.9 5.7 8.1 10.4 12.6 14.8 17.5 21.3
Other.......... 19.5 17.8 11.5 12.9 10.9 9.3 8.2 7.1 6.6
Net Interest..... 10.0 17.8 11.0 9.7 6.6 5.5 9.3 22.4 42.6
Surplus/Deficit (-) -14.2 -21.7 11.5 -5.4 1.6 -8.2 -16.9 -34.4 -59.6
Primary Surplus/Def -4.2 -3.3 22.5 4.3 8.2 -2.2 -7.7 -12.6 -16.9
Debt Held by Public 137.4 233.3 167.9 205.4 121.3 112.0 185.2 439.3 843.7
Projections without Proposed Entitlement Savings:
Mandatory Outlays.. 50.5 55.0 46.9 58.6 67.8 80.9 88.5 98.9 109.3
Surplus/Deficit (-) -14.2 -21.7 11.5 -5.9 -0.5 -13.7 -28.4 -62.8 -112.6
Primary Surplus/Def -4.2 -3.3 22.5 3.2 6.6 -6.6 -14.2 -24.6 -35.0
Debt Held by Public 137.4 233.3 167.9 206.5 132.8 153.6 286.3 765.0 1548.6
Source: Budget of the United States Government, FY 2009, Analytical Perspectives,
page 188, Table 13-2
==============================================================================================
MANDATORY PROPOSALS SUBJECT TO PAYGO IN 2009 BUDGET
(Cost/Savings (–) in millions of dollars)
------------------------------------- ------- ------- ------- ------- ------- ------- --------
Proposals 2008 2009 2010 2011 2012 2013 2008–13
------------------------------------- ------- ------- ------- ------- ------- ------- --------
Medicare............................. ...... –12,437 –26,875 –39,798 –45,741 –53,384 –178,235
State Children’s Health Insurance.... ...... 2,260 3,005 4,010 4,680 5,315 19,270
Medicaid............................. 140 –1,767 –2,924 –3,758 –4,305 –4,671 –17,285
Pension Benefit Guaranty premiums.... ...... –380 –2,217 –2,093 –2,127 –2,056 –8,873
Outlay effects of tax proposals* .... ...... –37 3,082 2,570 1,973 1,249 8,837
Social Services Block Grant.......... ...... ...... –1,445 –1,683 –1,700 –1,700 –6,528
Federal student aid programs......... ...... –2,763 –775 –801 –885 –859 –6,083
Arctic National Wildlife Ref. leasing ...... ...... –3,502 –2 –503 –3 –4,010
Other proposals...................... –148 –1,140 –1,807 –920 –660 –1,809 –6,484
Total................................ –8 –16,263 –33,458 –42,475 –49,268 –57,918 –199,391
Total, 2008 and 2009................. ...... –16,271 ...... ...... ...... ...... .......
----------------------------------------------------------------------------------------------
* Affects both receipts and outlays. Only the outlay effect is shown here. For receipt
effects, see Table S–7 in the Budget volume.
Source: Budget of the U.S. Government, FY 2009, Analytical Perspectives, page 215, Table 15-1
Note: The above table shows the budget’s mandatory proposals whose passage are assumed in
the long-run projections. The largest proposal involves Medicare and is described
as follows on page 215 of the Analytical Perspectives:
"In the Medicare Modernization Act (MMA) of 2003, Congress provided for a more
comprehensive review of the Medicare program’s finances and required the Medicare
trustees to issue a warning when general revenue Medicare funding is projected to
exceed 45 percent of Medicare’s total expenditures. The President’s Budget proposes
to build on this reform by requiring an automatic reduction in the rate of Medicare
growth if the MMA threshold is exceeded. The Medicare funding warning was triggered
in the 2007 Medicare Trustees’ Report because, for the second year in a row,
general revenue expenditures are projected to exceed the threshold within the next
six years. If action is not taken to keep this threshold from being exceeded, the
reduction would begin as a four-tenths of a percent reduction to all payments to
providers in the year the threshold is exceeded, and would grow by four-tenths of a
percent every year the shortfall continued to occur. This provision is designed to
encourage the President and the Congress to reach agreement on reforms to slow
Medicare spending and bring it back into line with the threshold established by the
MMA."
==============================================================================================
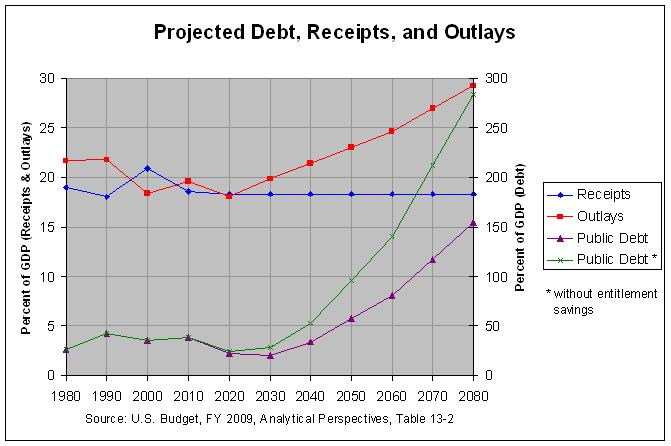
The above graphs and tables make evident the following points:
1) With the budget's mandatory proposals (listed in the third table above),
the debt held by the public is projected to drop to 20.5% of GDP by 2030.
It is then projected to climb, reaching 154.4% of GDP by 2080. Without
the mandatory proposals, the debt is projected to drop to just 24.3% of
GDP by 2020 and then climb, reaching 283.4% of GDP by 2080.
2) Receipts have fallen from the high of 20.9% of GDP that they reached in
2000. They fell to a low of 16.4% of GDP in 2004 but recovered to 18.8%
of GDP in 2007. They are projected to stabilize at about 18.3% of GDP
through 2080.
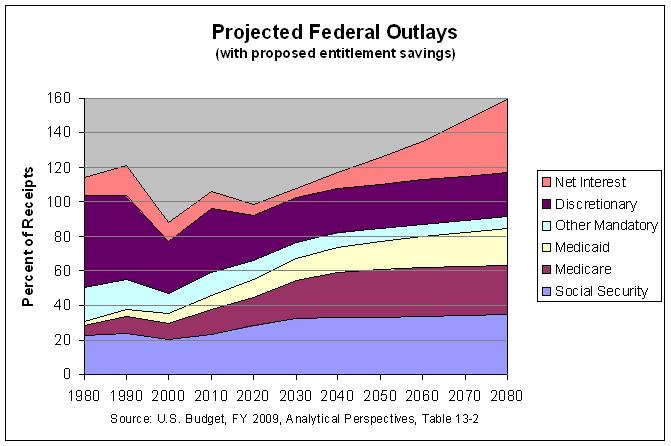
3) Outlays are projected to drop from their current level (20.0% of GDP in
2007) to 18.0% of GDP in 2020. They are then projected to rise to 29.2%
of GDP by 2080. Of this 11.2% of GDP increase, 6.6% is Net Interest,
2.2% is Medicare, 2.0% is Medicaid, and 1.2% is Social Security. There
is projected to be a drop of 0.8% of GDP in other mandatory spending and
discretionary spending is projected to remain at its 2020 level.
4) By 2080, the deficit is projected to rise to 10.9% of GDP and, as a
result, the debt held by the public is projected to rise to 154% of
GDP. Without the budget's mandatory proposals these figures are
projected to be 20.6% and 283% of GDP.