LONG-RUN BUDGET PROJECTIONS OF 2010 BUDGET POLICY: 1980-2080
(percent of GDP)
------------------------------------------------------------------------
1980 1990 2000 2010 2020 2030 2040 2060 2080
------------------------------------------------------------------------
Receipts........... 19.0 18.0 20.9 15.8 19.4 19.9 20.3 21.5 22.6
Outlays............ 21.7 21.8 18.4 24.4 22.9 25.9 28.5 33.0 38.2
Discretionary.... 10.1 8.7 6.3 9.6 6.2 6.2 6.2 6.2 6.2
Mandatory........ 9.6 9.9 9.8 13.9 13.8 16.2 17.6 19.1 20.8
Social Security 4.3 4.3 4.2 4.7 5.1 5.8 5.8 5.7 6.0
Medicare....... 1.1 1.7 2.0 3.1 4.0 5.6 6.8 8.3 9.6
Medicaid....... 0.5 0.7 1.2 2.0 2.1 2.4 2.8 3.1 3.3
Other.......... 3.7 3.2 2.4 4.1 2.7 2.4 2.2 2.0 2.0
Net Interest..... 1.9 3.2 2.3 0.9 2.9 3.5 4.8 7.7 11.2
Surplus/Deficit (-) -2.7 -3.9 2.4 -8.5 -3.5 -6.0 -8.2 -11.5 -15.5
Primary Surplus/Def -0.8 -0.6 4.7 -7.6 -0.6 -2.5 -3.5 -3.8 -4.4
Debt Held by Public 26.1 42.0 35.1 67.1 70.7 87.5 118.7 191.0 275.0
CBO Projections for Debt Held by Public:
Extended Baseline.. 26.2 42.8 34.5 60.6 56.2 67.1 94.0 167.0 283.0
Alternative Fiscal. 26.2 42.8 34.5 61.1 87.1 142.9 223.2 433.4 716.3
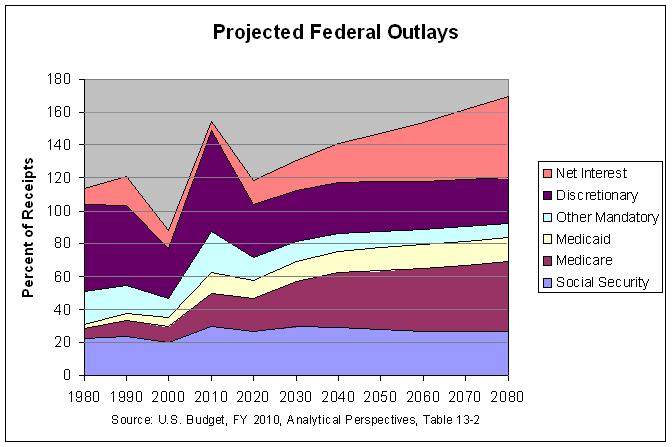
LONG-RUN BUDGET PROJECTIONS OF 2010 BUDGET POLICY: 1980-2080
(percent of Receipts)
------------------------------------------------------------------------
1980 1990 2000 2010 2020 2030 2040 2060 2080
------------------------------------------------------------------------
Receipts........... 100.0 100.0 100.0 100.0 100.0 100.0 100.0 100.0 100.0
Outlays............ 114.2 121.1 88.0 154.4 118.0 130.2 140.4 153.5 169.0
Discretionary.... 53.2 48.3 30.1 60.8 32.0 31.2 30.5 28.8 27.4
Mandatory........ 50.5 55.0 46.9 88.0 71.1 81.4 86.7 88.8 92.0
Social Security 22.6 23.9 20.1 29.7 26.3 29.1 28.6 26.5 26.5
Medicare....... 5.8 9.4 9.6 19.6 20.6 28.1 33.5 38.6 42.5
Medicaid....... 2.6 3.9 5.7 12.7 10.8 12.1 13.8 14.4 14.6
Other.......... 19.5 17.8 11.5 25.9 13.9 12.1 10.8 9.3 8.8
Net Interest..... 10.0 17.8 11.0 5.7 14.9 17.6 23.6 35.8 49.6
Surplus/Deficit (-) -14.2 -21.7 11.5 -53.8 -18.0 -30.2 -40.4 -53.5 -68.6
Primary Surplus/Def -4.2 -3.3 22.5 -48.1 -3.1 -12.6 -17.2 -17.7 -19.5
Debt Held by Public 137.4 233.3 167.9 424.7 364.4 439.7 584.7 888.4 1216.8
CBO Projections for Debt Held by Public:
Extended Baseline.. 137.9 237.8 165.1 383.5 289.7 337.2 463.1 776.7 1252.2
Alternative Fiscal. 137.9 237.8 165.1 386.7 449.0 718.1 1099.5 2015.8 3169.5
--------------------------------------------------------------------------------------------
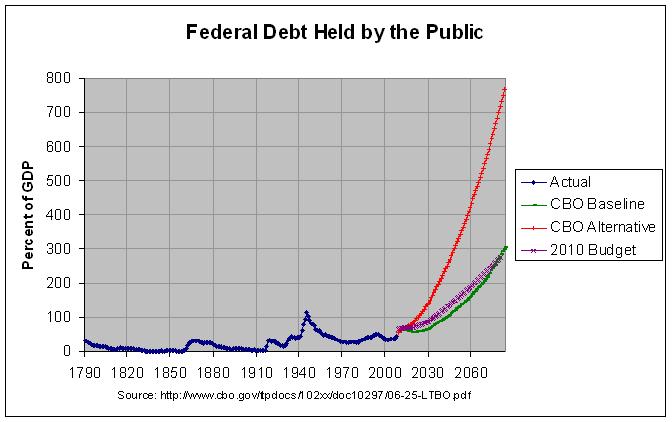
FEDERAL DEBT HELD BY THE PUBLIC AS A PERCENTAGE OF GDP
Calendar Calendar Calendar Calendar Calendar
Year Debt Year Debt Year Debt Year Debt Year Debt
------- ------- ------- ------- ------- ------- ------- ------- ------- -------
1790 29.6 1840 0.3 1890 7.8 1940 42.7 1990 42.8
1791 29.2 1841 0.8 1891 7.0 1941 43.3 1991 46.1
1792 28.0 1842 1.2 1892 6.6 1942 62.0 1992 48.3
1793 24.4 1843 1.5 1893 6.8 1943 77.1 1993 49.5
1794 21.8 1844 1.0 1894 7.9 1944 95.7 1994 49.2
1795 18.7 1845 0.7 1895 7.9 1945 112.7 1995 49.2
1796 16.4 1846 1.2 1896 8.5 1946 102.6 1996 47.9
1797 16.5 1847 1.7 1897 8.0 1947 90.4 1997 45.3
1798 16.0 1848 2.2 1898 8.4 1948 79.9 1998 42.3
1799 15.8 1849 2.5 1899 7.5 1949 81.4 1999 38.6
1800 15.1 1850 2.3 1900 6.6 1950 73.7 2000 34.5
1801 13.3 1851 2.4 1901 5.7 1951 63.7 2001 33.3
1802 13.9 1852 2.0 1902 5.4 1952 61.8 2002 34.7
1803 14.1 1853 1.4 1903 5.0 1953 60.2 2003 36.6
1804 13.2 1854 1.1 1904 4.7 1954 60.7 2004 37.4
1805 10.9 1855 0.9 1905 4.3 1955 55.5 2005 37.5
1806 10.0 1856 0.7 1906 4.0 1956 51.2 2006 37.0
1807 9.5 1857 0.9 1907 4.0 1957 48.1 2007 37.9
1808 8.9 1858 1.2 1908 4.3 1958 49.5 2008 44.0
1809 7.4 1859 1.5 1909 3.8 1959 47.0
1810 6.2 1860 1.9 1910 3.7 1960 44.8
1811 5.7 1861 7.2 1911 3.6 1961 44.6
1812 6.8 1862 16.8 1912 3.4 1962 42.9
1813 8.2 1863 23.8 1913 3.2 1963 41.4
1814 8.5 1864 25.6 1914 3.5 1964 39.0
1815 10.2 1865 31.0 1915 3.3 1965 36.5
1816 9.6 1866 31.4 1916 2.7 1966 33.7
1817 7.8 1867 31.4 1917 13.3 1967 33.4
1818 7.0 1868 30.5 1918 30.2 1968 31.2
1819 7.4 1869 30.0 1919 33.4 1969 28.5
1820 8.3 1870 27.9 1920 27.3 1970 28.2
1821 9.1 1871 25.7 1921 31.6 1971 27.7
1822 8.1 1872 24.4 1922 31.1 1972 26.8
1823 8.3 1873 23.2 1923 25.2 1973 24.8
1824 7.6 1874 24.0 1924 23.5 1974 24.6
1825 6.5 1875 23.7 1925 21.6 1975 26.6
1826 6.3 1876 24.1 1926 19.0 1976 28.1
1827 5.7 1877 23.9 1927 18.0 1977 27.8
1828 4.8 1878 25.5 1928 17.0 1978 26.8
1829 3.9 1879 23.0 1929 14.9 1979 25.7
1830 3.2 1880 18.4 1930 16.5 1980 26.2
1831 1.8 1881 16.8 1931 22.3 1981 26.3
1832 0.5 1882 14.3 1932 34.5 1982 30.0
1833 0.3 1883 13.5 1933 39.1 1983 33.4
1834 0.0 1884 13.3 1934 44.0 1984 34.5
1835 0.0 1885 13.2 1935 42.9 1985 37.1
1836 0.0 1886 12.4 1936 43.0 1986 39.8
1837 0.2 1887 11.2 1937 40.1 1987 40.7
1838 0.6 1888 10.2 1938 42.8 1988 40.9
1839 0.2 1889 8.6 1939 43.0 1989 41.0
-------------------------------------------------------------------------------
PROJECTED FEDERAL DEBT HELD BY THE PUBLIC AS A PERCENTAGE OF GDP
CBO CBO U.S. CBO CBO U.S.
Extended Alter- Budget Extended Alter- Budget
Year Baseline native FY 2010 Year Baseline native FY 2010
-------- -------- -------- -------- -------- -------- -------- --------
2009 56.6 56.6 63.9
2010 60.6 61.1 67.1 2050 127.6 321.3 154.9
2011 62.0 64.0 67.5 2051 131.2 331.6 158.5
2012 61.5 65.4 67.8 2052 134.9 342.6 162.1
2013 60.7 67.0 68.2 2053 138.5 353.0 165.7
2014 60.1 69.0 68.5 2054 142.4 364.2 169.3
2015 59.5 71.4 68.9 2055 146.3 375.5 172.9
2016 59.0 74.1 69.3 2056 150.5 387.1 176.5
2017 57.9 76.7 69.6 2057 154.3 398.3 180.2
2018 56.1 78.9 70.0 2058 158.5 410.2 183.8
2019 56.0 82.8 70.3 2059 162.5 421.7 187.4
2020 56.2 87.1 70.7 2060 167.0 433.4 191.0
2021 56.5 91.7 72.4 2061 171.6 446.3 195.2
2022 57.0 96.4 74.1 2062 176.2 458.8 199.4
2023 57.5 101.1 75.7 2063 180.5 470.9 203.6
2024 58.2 106.1 77.4 2064 185.4 483.6 207.8
2025 59.2 111.5 79.1 2065 190.2 495.6 212.0
2026 60.3 117.1 80.8 2066 195.3 509.0 216.2
2027 61.7 123.1 82.5 2067 200.5 522.5 220.4
2028 63.3 129.4 84.1 2068 206.1 536.5 224.6
2029 65.1 135.9 85.8 2069 211.6 550.6 228.8
2030 67.1 142.9 87.5 2070 217.2 564.2 233.0
2031 69.3 149.9 90.6 2071 223.0 577.7 237.2
2032 71.5 157.2 93.7 2072 229.0 592.4 241.4
2033 74.0 164.8 96.9 2073 235.1 607.1 245.6
2034 76.6 172.7 100.0 2074 241.2 621.2 249.8
2035 79.3 180.6 103.1 2075 247.5 636.1 254.0
2036 82.1 188.8 106.2 2076 254.1 651.7 258.2
2037 84.8 196.9 109.3 2077 260.9 667.0 262.4
2038 87.9 205.8 112.5 2078 268.4 684.1 266.6
2039 91.0 214.6 115.6 2079 275.5 700.1 270.8
2040 94.0 223.2 118.7 2080 283.0 716.3 275.0
2041 97.2 232.4 122.3 2081 290.6 733.0
2042 100.4 241.6 125.9 2082 298.5 750.1
2043 103.6 251.0 129.5 2083 306.3 766.9
2044 106.8 260.6 133.2
2045 110.3 270.4 136.8
2046 113.6 280.2 140.4
2047 117.1 290.2 144.0
2048 120.5 299.9 147.6
2049 124.1 310.7 151.2
-------------------------------------------------------------------------------------------
Source: Budget of the United States Government, FY 2010 , Analytical Perspectives,
page 192, Table 13-2;
The Long-Term Budget Outlook, Supplemental Data, Congressional Budget
Office, tabs F1-3 and F-Box 1-3
Notes: Budget figures are for fiscal year, CBO figures are for calendar year.
===========================================================================================
ASSUMPTIONS ABOUT FEDERAL SPENDING AND REVENUE SOURCES UNDERLYING CBO'S
LONG-TERM BUDGET SCENARIOS
Extended-Baseline Scenario Alternative Fiscal Scenario
----------------------------------- -------------------------------------
Assumptions About Spending
Medicare As scheduled under current law Physician payment rates grow with the
Medicare economic index (rather
than at the lower growth rates
scheduled under the sustainable
growth rate mechanism)
Medicaid As scheduled under current law As scheduled under current law
Social Security As scheduled under current law As scheduled under current law
Other Spending As projected in CBO’s baseline As projected in CBO’s baseline
Excluding through 2019, remaining through 2011, remaining
Interest thereafter at the projected 2019 thereafter at the projected 2009
level as a share of GDP level, minus stimulus and related
spending, as a share of GDP
Assumptions About Revenue Sources
Individual As scheduled under current law Tax provisions in JGTRRA and EGTRRA
Income Taxes are extended and AMT parameters are
indexed for inflation after 2009
Corporate As scheduled under current law As scheduled under current law
Income Taxes
Payroll Taxes As scheduled under current law As scheduled under current law
Excise Taxes & As scheduled under current law Constant as a share of GDP over the
Estate and long term
Gift Taxes
Other Revenues As scheduled under current law As scheduled under current law
through 2019, remaining constant through 2019, remaining constant
as a share of GDP thereafter as a share of GDP thereafter
--------------------------------------------------------------------------------------------
Source: The Long-Term Budget Outlook, Congressional Budget Office, page 2, Table 1-1
Notes: The extended-baseline scenario adheres closely to current law, following CBO’s
10-year baseline budget projections from 2009 to 2019 and then extending the
baseline concept for the rest of the projection period. The alternative fiscal
scenario deviates from CBO’s baseline projections, beginning in 2010, by
incorporating some changes in policy that are widely expected to occur and that
policymakers have regularly made in the past.
GDP = gross domestic product; JGTRRA = Jobs and Growth Tax Relief Reconciliation
Act of 2003; EGTRRA = Economic Growth and Tax Relief Reconciliation Act of 2001;
AMT = alternative minimum tax.
Go to Related blog entry
Go to Budget Home Page
