LONG-RUN BUDGET PROJECTIONS FROM THE 2012 BUDGET: 1980-2085
(percent of GDP)
------------------------------------------------------------------------
1980 1990 2000 2010 2020 2030 2050 2060 2085
------------------------------------------------------------------------
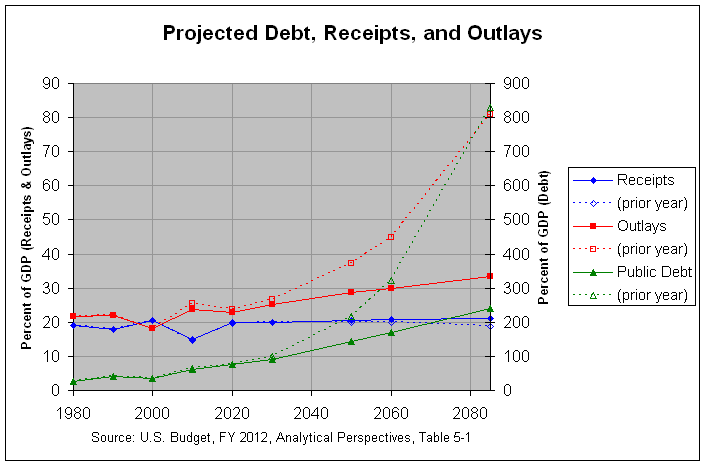
Receipts........... 19.0 18.0 20.6 14.9 19.9 19.8 20.5 20.7 21.2
Outlays............ 21.7 21.9 18.2 23.8 23.0 25.3 28.7 29.9 33.5
Discretionary.... 10.1 8.7 6.3 9.0 5.7 5.5 5.5 5.5 5.5
Mandatory........ 9.6 9.9 9.7 13.5 13.9 15.8 16.7 16.7 17.1
Social Security 4.3 4.3 4.1 4.8 5.1 5.7 5.6 5.6 5.9
Medicare....... 1.1 1.7 2.0 3.1 3.3 4.3 5.1 5.2 5.3
Medicaid....... 0.5 0.7 1.2 1.9 2.4 2.8 3.3 3.3 3.3
Other.......... 3.7 3.2 2.4 3.7 3.2 3.0 2.7 2.6 2.6
Net Interest..... 1.9 3.2 2.3 1.4 3.4 4.1 6.5 7.7 10.9
Surplus/Deficit (-) -2.7 -3.9 2.4 -8.9 -3.1 -5.5 -8.2 -9.2 -12.3
Primary Surplus/Def -0.8 -0.6 4.7 -7.6 0.2 -1.5 -1.7 -1.4 -1.4
Debt Held by Public 26.1 42.1 34.7 62.2 76.7 90.4 144.3 170.0 239.9
LONG-RUN BUDGET PROJECTIONS FROM THE 2012 BUDGET: 1980-2085
(percent of receipts)
------------------------------------------------------------------------
1980 1990 2000 2010 2020 2030 2050 2060 2085
------------------------------------------------------------------------
Receipts........... 100.0 100.0 100.0 100.0 100.0 100.0 100.0 100.0 100.0
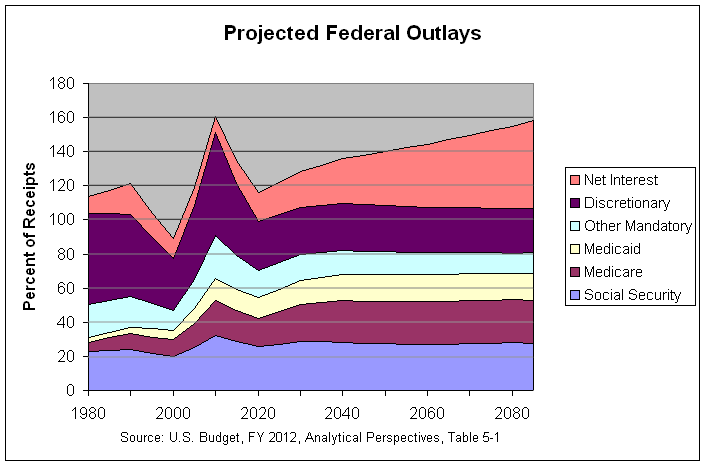
Outlays............ 114.2 121.7 88.3 159.7 115.6 127.8 140.0 144.4 158.0
Discretionary.... 53.2 48.3 30.6 60.4 28.6 27.8 26.8 26.6 25.9
Mandatory........ 50.5 55.0 47.1 90.6 69.8 79.8 81.5 80.7 80.7
Social Security 22.6 23.9 19.9 32.2 25.6 28.8 27.3 27.1 27.8
Medicare....... 5.8 9.4 9.7 20.8 16.6 21.7 24.9 25.1 25.0
Medicaid....... 2.6 3.9 5.8 12.8 12.1 14.1 16.1 15.9 15.6
Other.......... 19.5 17.8 11.7 24.8 16.1 15.2 13.2 12.6 12.3
Net Interest..... 10.0 17.8 11.2 9.4 17.1 20.7 31.7 37.2 51.4
Surplus/Deficit (-) -14.2 -21.7 11.7 -59.7 -15.6 -27.8 -40.0 -44.4 -58.0
Primary Surplus/Def -4.2 -3.3 22.8 -51.0 1.0 -7.6 -8.3 -6.8 -6.6
Debt Held by Public 137.4 233.9 168.4 417.4 385.4 456.6 703.9 821.3 1131.6
============================================================================================
LONG-RUN BUDGET PROJECTIONS FROM THE 2011 BUDGET: 1980-2080
(percent of GDP)
------------------------------------------------------------------------
1980 1990 2000 2010 2020 2030 2050 2060 2085
------------------------------------------------------------------------
Receipts........... 19.0 18.0 20.6 14.8 19.6 19.8 20.0 19.9 18.7
Outlays............ 21.7 21.9 18.2 25.4 23.7 26.8 37.2 44.9 81.0
Discretionary.... 10.1 8.7 6.3 9.6 6.2 6.1 6.1 6.1 6.1
Mandatory........ 9.6 9.9 9.7 14.5 14.1 16.1 21.1 24.0 36.9
Social Security 4.3 4.3 4.1 4.9 5.0 5.6 5.4 5.3 5.1
Medicare....... 1.1 1.7 2.0 3.1 4.0 5.3 9.6 11.9 22.0
Medicaid....... 0.5 0.7 1.2 1.9 2.0 2.4 3.5 4.1 6.6
Other.......... 3.7 3.2 2.4 4.7 3.1 2.8 2.6 2.6 3.1
Net Interest..... 1.9 3.2 2.3 1.3 3.5 4.5 10.0 14.8 38.0
Surplus/Deficit (-) -2.7 -3.9 2.4 -10.6 -4.2 -6.9 -17.1 -25.0 -62.3
Primary Surplus/Def -0.8 -0.6 4.7 -9.4 -0.7 -2.4 -7.2 -10.2 -24.3
Debt Held by Public 26.1 42.1 34.7 63.6 77.2 98.8 218.1 323.7 829.7
LONG-RUN BUDGET PROJECTIONS FROM THE 2011 BUDGET: 1980-2085
(percent of receipts)
------------------------------------------------------------------------
1980 1990 2000 2010 2020 2030 2050 2060 2085
------------------------------------------------------------------------
Receipts........... 100.0 100.0 100.0 100.0 100.0 100.0 100.0 100.0 100.0
Outlays............ 114.2 121.7 88.3 171.6 120.9 135.4 186.0 225.6 433.2
Discretionary.... 53.2 48.3 30.6 64.9 31.6 30.8 30.5 30.7 32.6
Mandatory........ 50.5 55.0 47.1 98.0 71.9 81.3 105.5 120.6 197.3
Social Security 22.6 23.9 19.9 33.1 25.5 28.3 27.0 26.6 27.3
Medicare....... 5.8 9.4 9.7 20.9 20.4 26.8 48.0 59.8 117.6
Medicaid....... 2.6 3.9 5.8 12.8 10.2 12.1 17.5 20.6 35.3
Other.......... 19.5 17.8 11.7 31.8 15.8 14.1 13.0 13.1 16.6
Net Interest..... 10.0 17.8 11.2 8.8 17.9 22.7 50.0 74.4 203.2
Surplus/Deficit (-) -14.2 -21.7 11.7 -71.6 -21.4 -34.8 -85.5 -125.6 -333.2
Primary Surplus/Def -4.2 -3.3 22.8 -63.5 -3.6 -12.1 -36.0 -51.3 -129.9
Debt Held by Public 137.4 233.9 168.4 429.7 393.9 499.0 1090.5 1626.6 4436.9
============================================================================================
CHANGE IN LONG-RUN BUDGET PROJECTIONS FROM THE 2011 TO THE 2012 BUDGET: 1980-2085
(percent of GDP)
------------------------------------------------------------------------
1980 1990 2000 2010 2020 2030 2050 2060 2085
------------------------------------------------------------------------
Receipts........... 0.0 0.0 0.0 0.1 0.3 0.0 0.5 0.8 2.5
Outlays............ 0.0 0.0 0.0 -1.6 -0.7 -1.5 -8.5 -15.0 -47.5
Discretionary.... 0.0 0.0 0.0 -0.6 -0.5 -0.6 -0.6 -0.6 -0.6
Mandatory........ 0.0 0.0 0.0 -1.0 -0.2 -0.3 -4.4 -7.3 -19.8
Social Security 0.0 0.0 0.0 -0.1 0.1 0.1 0.2 0.3 0.8
Medicare....... 0.0 0.0 0.0 0.0 -0.7 -1.0 -4.5 -6.7 -16.7
Medicaid....... 0.0 0.0 0.0 0.0 0.4 0.4 -0.2 -0.8 -3.3
Other.......... 0.0 0.0 0.0 -1.0 0.1 0.2 0.1 0.0 -0.5
Net Interest..... 0.0 0.0 0.0 0.1 -0.1 -0.4 -3.5 -7.1 -27.1
Surplus/Deficit (-) 0.0 0.0 0.0 1.7 1.1 1.4 8.9 15.8 50.0
Primary Surplus/Def 0.0 0.0 0.0 1.8 0.9 0.9 5.5 8.8 22.9
Debt Held by Public 0.0 0.0 0.0 -1.4 -0.5 -8.4 -73.8 -153.7 -589.8
--------------------------------------------------------------------------------------------
Note 1: The figures from the 2012 Budget beyond 2020 are the product of a long-range
forecasting model maintained by the Office of Management and Budget. This model
is separate from the models and capabilities that produce detailed programmatic
estimates in the Budget. It was designed to produce long-range projections based
on additional assumptions regarding growth in the economy, the long-range evolution
of specific programs, and the demographic and economic forces affecting those
programs. The model, its assumptions, and sensitivity testing of those assumptions
are presented in Chapter 5 of the Analytical Perspectives.
Note 2: The figures from the 2011 Budget did not include any possible savings from health
care reform proposals that were being considered when that budget was released.
However, the figures from the 2012 Budget do include projected savings from the
Affordable Care Act (ACA).
Source: Budget of the United States Government, FY 2012 , Analytical Perspectives,
page 51, Table 5-1;
Budget of the United States Government, FY 2011 , Analytical Perspectives,
page 47, Table 5-1;
Go to Related blog entry
Go to Budget Home Page
