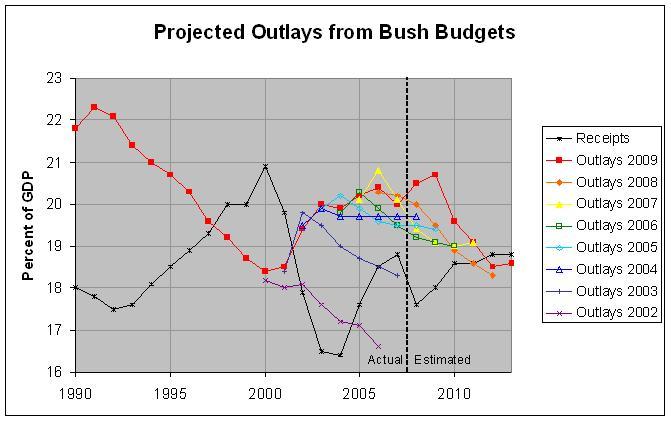
      RECEIPTS, OUTLAYS, AND PROJECTED OUTLAYS FROM BUSH BUDGETS (percent of GDP)

                        Projected Outlays from Budgets for Fiscal Year   Surplus or
                        ------------------------------------------------ Deficit(-)  GDP
Year Receipts  Outlays    2008   2007   2006   2005   2004   2003   2002           ($bil)
---- -------- --------  ------ ------ ------ ------ ------ ------ ------ ------- -------
1990     18.0     21.8                                                     -3.9   5735.4
1991     17.8     22.3                                                     -4.5   5935.1
1992     17.5     22.1                                                     -4.7   6239.9
1993     17.6     21.4                                                     -3.9   6575.5
1994     18.1     21.0                                                     -2.9   6961.3
1995     18.5     20.7                                                     -2.2   7325.8
1996     18.9     20.3                                                     -1.4   7694.1
1997     19.3     19.6                                                     -0.3   8182.4
1998     20.0     19.2                                                      0.8   8627.9
1999     20.0     18.7                                                      1.4   9125.3
2000     20.9     18.4                                             18.2     2.4   9709.8
2001     19.8     18.5                                      18.4   18.0     1.3  10057.9
2002     17.9     19.4                               19.5   19.8   18.1    -1.5  10377.4
2003     16.5     20.0                        19.9   19.9   19.5   17.6    -3.5  10808.6
2004     16.4     19.9                 19.8   20.2   19.7   19.0   17.2    -3.6  11499.9
2005     17.6     20.2          20.1   20.3   19.9   19.7   18.7   17.1    -2.6  12237.9
2006     18.5     20.4   20.3   20.8   19.9   19.6   19.7   18.5   16.6    -1.9  13015.5
2007     18.8     20.0   20.2   20.1   19.5   19.5   19.7   18.3           -1.2  13667.5

2008*    17.6     20.5   20.0   19.4   19.2   19.5   19.7                  -2.9  14311.5
2009*    18.0     20.7   19.5   19.1   19.1   19.4                         -2.7  15027.0
2010*    18.6     19.6   18.9   19.0   19.0                                -1.0  15792.0
2011*    18.6     19.1   18.6   19.1                                       -0.6  16580.2
2012*    18.8     18.5   18.3                                               0.3  17395.0
2013*    18.8     18.6                                                      0.2  18243.3

* projected in the 2009 Budget

Note: For each of the other budgets (2002 to 2008), all of the numbers
      except for the first are projected.

Budget      First    Declining or
Fiscal  Projected  Steady Outlays
  Year       Year       Projected
------  ---------  --------------
  2002       2001       2002-2006
  2003       2002       2002-2007
  2004       2003       2003-2008
  2005       2004       2004-2009
  2006       2005       2005-2010
  2007       2006       2006-2010
  2008       2007       2006-2012
  2009       2008       2009-2012

Source: Budget of the United States Government, FY 2009, Historical Tables,
        tables 2.1 and 10.1;
        Budget of the United States Government, FY 2008, 2007, 2006, 2005,
        2004, 2003, and 2002, Historical Tables, table 2.1
Go to Budget Home Page
