OPEN GROUP* - TOTAL PRESENT VALUE OF FUTURE EXPENDITURES IN EXCESS OF FUTURE REVENUE (billions of dollars)
Start year of 75-year projection period (see notes) 2000 2001 2002 2003 2004 2005 2006 2007
------------------------------------------------------------- ------ ------ ------ ------ ------ ------ ------ ------
Old-Age, Survivors and Disability Insurance (Social Security) 3845 4207 4562 4927 5229 5704 6449 6763
Hospital Insurance (Medicare Part A) 2699 4730 5126 6166 8492 8829 11290 12292
Supplementary Medical Insurance (Medicare Part B) 6494 8084 8125 9653 11440 12384 13131 13432
Supplementary Medical Insurance (Medicare Part D) 8119 8686 7884 8361
Railroad Retirement 77# 77 79 83 87 91 101 105
Black Lung (Part C) -4 -4 -5 -4 -4 -5 -4 -5
------------------------------------------------------------- ------ ------ ------ ------ ------ ------ ------ ------
Total Social Insurance Exposures (not on balance sheet) 13111 17094 17887 20825 33363 35689 38851 40948
-----------------------------------------------------------------------------------------------------------------------------
CLOSED GROUP^ - TOTAL PRESENT VALUE OF FUTURE EXPENDITURES IN EXCESS OF FUTURE REVENUE (billions of dollars)
Start year of 75-year projection period (see notes) 2000 2001 2002 2003 2004 2005 2006 2007
------------------------------------------------------------- ------ ------ ------ ------ ------ ------ ------ ------
Old-Age, Survivors and Disability Insurance (Social Security) 9636 10542 11215 11742 12551 13584 14975 16265
Hospital Insurance (Medicare Part A) 4529 6012 6409 7286 9255 9621 12153 12044
Supplementary Medical Insurance (Medicare Part B) 5384 6471 6487 7719 9054 9900 10630 10347
Supplementary Medical Insurance (Medicare Part D) 6306 6818 6255 6273
Railroad Retirement 105# 105 107 110 112 116 132 133
Black Lung (Part C) 0 0 0 0 0 0 0 0
------------------------------------------------------------- ------ ------ ------ ------ ------ ------ ------ ------
Total Social Insurance Exposures (not on balance sheet) 19654 23130 24218 26857 37278 40039 44145 45062
Gross Domestic Product 9710 10058 10377 10809 11500 12238 13016 13668
=============================================================================================================================
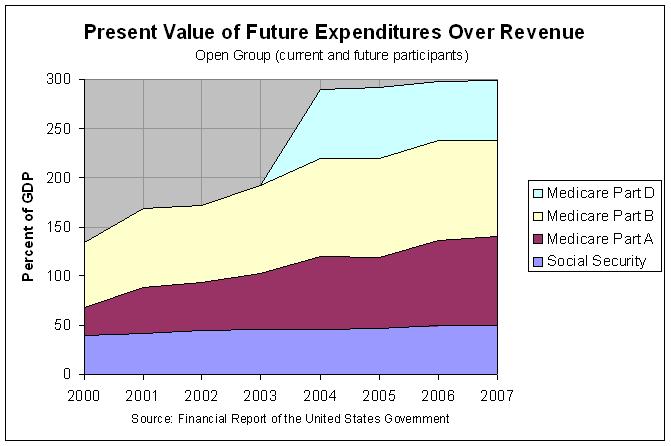
OPEN GROUP* - TOTAL PRESENT VALUE OF FUTURE EXPENDITURES IN EXCESS OF FUTURE REVENUE (percent of GDP)
Start year of 75-year projection period (see notes) 2000 2001 2002 2003 2004 2005 2006 2007
------------------------------------------------------------- ------ ------ ------ ------ ------ ------ ------ ------
Old-Age, Survivors and Disability Insurance (Social Security) 39.6 41.8 44.0 45.6 45.5 46.6 49.5 49.5
Hospital Insurance (Medicare Part A) 27.8 47.0 49.4 57.0 73.8 72.1 86.7 89.9
Supplementary Medical Insurance (Medicare Part B) 66.9 80.4 78.3 89.3 99.5 101.2 100.9 98.3
Supplementary Medical Insurance (Medicare Part D) 70.6 71.0 60.6 61.2
Railroad Retirement 0.8# 0.8 0.8 0.8 0.8 0.7 0.8 0.8
Black Lung (Part C) 0.0 0.0 0.0 0.0 0.0 0.0 0.0 0.0
------------------------------------------------------------- ------ ------ ------ ------ ------ ------ ------ ------
Total Social Insurance Exposures (not on balance sheet) 135.0 170.0 172.4 192.7 290.1 291.6 298.5 299.6
-----------------------------------------------------------------------------------------------------------------------------
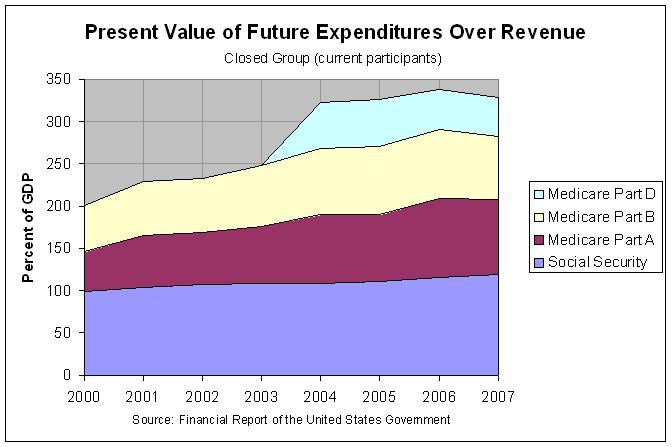
CLOSED GROUP^ - TOTAL PRESENT VALUE OF FUTURE EXPENDITURES IN EXCESS OF FUTURE REVENUE (percent of GDP)
Start year of 75-year projection period (see notes) 2000 2001 2002 2003 2004 2005 2006 2007
------------------------------------------------------------- ------ ------ ------ ------ ------ ------ ------ ------
Old-Age, Survivors and Disability Insurance (Social Security) 99.2 104.8 108.1 108.6 109.1 111.0 115.1 119.0
Hospital Insurance (Medicare Part A) 46.6 59.8 61.8 67.4 80.5 78.6 93.4 88.1
Supplementary Medical Insurance (Medicare Part B) 55.4 64.3 62.5 71.4 78.7 80.9 81.7 75.7
Supplementary Medical Insurance (Medicare Part D) 54.8 55.7 48.1 45.9
Railroad Retirement 1.0# 1.0 1.0 1.0 1.0 0.9 1.0 1.0
Black Lung (Part C) 0.0 0.0 0.0 0.0 0.0 0.0 0.0 0.0
------------------------------------------------------------- ------ ------ ------ ------ ------ ------ ------ ------
Total Social Insurance Exposures (not on balance sheet) 202.4 230.0 233.4 248.5 324.2 327.2 339.2 329.7
=============================================================================================================================
* Closed group includes current participants (i.e., receiving and/or are eligible to receive benefits) ages 15 and over at
the start of the period.
^ Open group includes all current and future projected participants (i.e., individuals receiving and/or eligible to receive
benefits ages 15 and over at the start of the period, PLUS participants estimated to receive and/or be eligible for
benefits over the 75-yr horizon).
# Figure from 2001 (figures from 2000 were not calculated by the Railroad Retirement Board).
Notes:
1) The above tables show the present value of 75-year actuarial projections of benefit payments under current law for Social
Security, Medicare, and other social insurance programs (see next note) in excess of their scheduled contributions and
earmarked taxes. Not considered liabilities on the balance sheet.
2) Black Lung’s long-range actuarial projections are through 2040 when the program is scheduled to terminate (i.e., a
33-year period).
3) Present values recognize that a dollar paid or collected in the future is worth less than a dollar today, because a dollar
today could be invested and earn interest. To calculate a present value, future amounts are thus reduced using an assumed
interest rate, and those reduced amounts are summed.
Source: Financial Report of the United States, Fiscal Years 2004, 2005, 2006, and 2007;
Budget of the United States Government, FY 2009: Historical Tables, table 10.1