RECEIPTS BY SOURCE, OUTLAYS, AND GDP: 1940-2012
(in billions of dollars)
Individ Corporate Social Excise Total Total
Year Income Income Insurance Tax Other Receipts Outlays GDP
---- --------- --------- --------- -------- -------- -------- -------- --------
1940 0.89 1.20 1.79 1.98 0.70 6.55 9.47 96.8
1941 1.31 2.12 1.94 2.55 0.78 8.71 13.65 114.1
1942 3.26 4.72 2.45 3.40 0.80 14.63 35.14 144.3
1943 6.51 9.56 3.04 4.10 0.80 24.00 78.56 180.3
1944 19.71 14.84 3.47 4.76 0.97 43.75 91.30 209.2
1945 18.37 15.99 3.45 6.27 1.08 45.16 92.71 221.4
1946 16.10 11.88 3.12 7.00 1.20 39.30 55.23 222.7
1947 17.94 8.62 3.42 7.21 1.33 38.51 34.50 233.2
1948 19.32 9.68 3.75 7.36 1.46 41.56 29.76 256.0
1949 15.55 11.19 3.78 7.50 1.39 39.42 38.84 271.1
1950 15.76 10.45 4.34 7.55 1.35 39.44 42.56 273.0
1951 21.62 14.10 5.67 8.65 1.58 51.62 45.51 320.6
1952 27.93 21.23 6.45 8.85 1.71 66.17 67.69 348.6
1953 29.82 21.24 6.82 9.88 1.86 69.61 76.10 372.9
1954 29.54 21.10 7.21 9.95 1.91 69.70 70.86 377.3
1955 28.75 17.86 7.86 9.13 1.85 65.45 68.44 394.6
1956 32.19 20.88 9.32 9.93 2.27 74.59 70.64 427.2
1957 35.62 21.17 10.00 10.53 2.67 79.99 76.58 450.3
1958 34.72 20.07 11.24 10.64 2.96 79.64 82.41 460.5
1959 36.72 17.31 11.72 10.58 2.92 79.25 92.10 491.5
1960 40.72 21.49 14.68 11.68 3.92 92.49 92.19 517.9
1961 41.34 20.95 16.44 11.86 3.80 94.39 97.72 530.8
1962 45.57 20.52 17.05 12.53 4.00 99.68 106.82 567.6
1963 47.59 21.58 19.80 13.19 4.40 106.56 111.32 598.7
1964 48.70 23.49 21.96 13.73 4.73 112.61 118.53 640.4
1965 48.79 25.46 22.24 14.57 5.75 116.82 118.23 687.1
1966 55.45 30.07 25.55 13.06 6.71 130.84 134.53 752.9
1967 61.53 33.97 32.62 13.72 6.99 148.82 157.46 811.8
1968 68.73 28.67 33.92 14.08 7.58 152.97 178.13 866.6
1969 87.25 36.68 39.02 15.22 8.72 186.88 183.64 948.6
1970 90.41 32.83 44.36 15.71 9.50 192.81 195.65 1012.2
1971 86.23 26.79 47.33 16.61 10.19 187.14 210.17 1079.9
1972 94.74 32.17 52.57 15.48 12.36 207.31 230.68 1178.3
1973 103.25 36.15 63.12 16.26 12.03 230.80 245.71 1307.6
1974 118.95 38.62 75.07 16.84 13.74 263.22 269.36 1439.3
1975 122.39 40.62 84.53 16.55 15.00 279.09 332.33 1560.7
1976 131.60 41.41 90.77 16.96 17.32 298.06 371.79 1736.5
1977 157.63 54.89 106.49 17.55 19.01 355.56 409.22 1974.3
1978 180.99 59.95 120.97 18.38 19.28 399.56 458.75 2217.0
1979 217.84 65.68 138.94 18.75 22.10 463.30 504.03 2500.7
1980 244.07 64.60 157.80 24.33 26.31 517.11 590.94 2726.7
1981 285.92 61.14 182.72 40.84 28.66 599.27 678.24 3054.7
1982 297.74 49.21 201.50 36.31 33.01 617.77 745.74 3227.6
1983 288.94 37.02 208.99 35.30 30.31 600.56 808.36 3440.7
1984 298.42 56.89 239.38 37.36 34.44 666.49 851.85 3840.2
1985 334.53 61.33 265.16 35.99 37.07 734.09 946.40 4141.5
1986 348.96 63.14 283.90 32.92 40.29 769.22 990.44 4412.4
1987 392.56 83.93 303.32 32.46 42.10 854.35 1004.08 4647.1
1988 401.18 94.51 334.34 35.23 44.05 909.30 1064.48 5008.6
1989 445.69 103.29 359.42 34.39 48.41 991.19 1143.83 5400.5
1990 466.88 93.51 380.05 35.35 56.31 1032.09 1253.13 5735.4
1991 467.83 98.09 396.02 42.40 50.76 1055.09 1324.33 5935.1
1992 475.96 100.27 413.69 45.57 55.84 1091.33 1381.65 6239.9
1993 509.68 117.52 428.30 48.06 50.91 1154.47 1409.52 6575.5
1994 543.06 140.39 461.48 55.23 58.58 1258.72 1461.91 6961.3
1995 590.24 157.00 484.47 57.48 62.73 1351.93 1515.88 7325.8
1996 656.42 171.82 509.41 54.01 61.51 1453.18 1560.61 7694.1
1997 737.47 182.29 539.37 56.92 63.37 1579.42 1601.31 8182.4
1998 828.59 188.68 571.83 57.67 75.19 1721.96 1652.69 8627.9
1999 879.48 184.68 611.83 70.41 81.24 1827.65 1702.04 9125.3
2000 1004.46 207.29 652.85 68.87 91.99 2025.46 1789.22 9709.8
2001 994.34 151.08 693.97 66.23 85.81 1991.43 1863.19 10057.9
2002 858.35 148.04 700.76 66.99 79.26 1853.40 2011.15 10377.4
2003 793.70 131.78 712.98 67.52 76.55 1782.53 2160.12 10808.6
2004 808.96 189.37 733.41 69.86 78.69 1880.28 2293.01 11517.5
2005 927.22 278.28 794.13 73.09 81.14 2153.86 2472.21 12265.8
2006 1043.91 353.92 837.82 73.96 97.65 2407.25 2655.44 13061.1
2007* 1168.85 342.06 873.38 57.06 98.75 2540.10 2784.27 13761.2
2008* 1246.61 314.94 927.20 68.11 105.62 2662.47 2901.86 14515.0
2009* 1331.14 319.81 974.21 63.08 110.07 2798.31 2985.47 15306.4
2010* 1428.32 325.46 1029.31 63.60 108.04 2954.72 3049.09 16112.4
2011* 1517.29 340.58 1085.69 68.60 91.40 3103.55 3157.33 16937.8
2012* 1636.57 366.64 1138.76 71.33 94.04 3307.32 3246.31 17786.0
-------------------------------------------------------------------------------
RECEIPTS BY SOURCE, OUTLAYS, AND GDP: 1940-2012
(in billions of constant 2000 dollars)
Individ Corporate Social Excise Total Total Outlay
Year Income Income Insurance Tax Other Receipts Outlays GDP Deflator
---- --------- --------- --------- -------- -------- -------- -------- -------- --------
1940 10.25 13.76 20.52 22.72 8.02 75.26 108.83 1112.6 0.0870
1941 14.16 22.89 20.91 27.50 8.42 93.88 147.12 1229.5 0.0928
1942 31.74 45.90 23.85 33.06 7.79 142.35 341.80 1403.7 0.1028
1943 57.98 85.18 27.13 36.51 7.13 213.91 700.13 1607.0 0.1122
1944 185.72 139.85 32.73 44.85 9.16 412.32 860.55 1971.7 0.1061
1945 176.48 153.58 33.15 60.18 10.40 433.80 890.61 2126.8 0.1041
1946 150.31 110.95 29.08 65.34 11.22 366.91 515.70 2079.4 0.1071
1947 154.35 74.14 29.45 62.06 11.45 331.45 296.87 2006.9 0.1162
1948 151.73 76.03 29.47 57.78 11.48 326.47 233.81 2011.0 0.1273
1949 124.82 89.82 30.35 60.21 11.14 316.33 311.68 2175.8 0.1246
1950 122.42 81.19 33.71 58.66 10.50 306.47 330.71 2121.2 0.1287
1951 169.01 110.25 44.36 67.62 12.34 403.57 355.86 2506.6 0.1279
1952 218.23 165.83 50.35 69.16 13.36 516.93 528.80 2723.4 0.1280
1953 217.95 155.25 49.85 72.20 13.57 508.83 556.29 2725.9 0.1368
1954 209.67 149.76 51.16 70.58 13.52 494.68 502.87 2677.8 0.1409
1955 197.57 122.76 54.03 62.76 12.71 449.84 470.41 2712.0 0.1455
1956 210.93 136.83 61.07 65.07 14.88 488.77 462.91 2799.5 0.1526
1957 222.49 132.21 62.44 65.80 16.69 499.63 478.31 2812.6 0.1601
1958 205.83 118.99 66.62 63.06 17.55 472.06 488.47 2729.7 0.1687
1959 210.30 99.14 67.14 60.58 16.73 453.89 527.48 2815.0 0.1746
1960 232.66 122.82 83.90 66.72 22.42 528.53 526.81 2959.4 0.1750
1961 230.30 116.74 91.58 66.07 21.15 525.84 544.42 2957.1 0.1795
1962 252.75 113.83 94.54 69.52 22.19 552.83 592.46 3148.1 0.1803
1963 254.07 115.21 105.73 70.44 23.47 568.93 594.32 3196.5 0.1873
1964 256.30 123.65 115.59 72.27 24.90 592.70 623.83 3370.5 0.1900
1965 253.07 132.06 115.36 75.57 29.84 605.90 613.22 3563.8 0.1928
1966 280.88 152.35 129.41 66.17 33.98 662.79 681.52 3814.1 0.1974
1967 303.68 167.68 161.00 67.71 34.49 734.56 777.22 4006.9 0.2026
1968 326.80 136.31 161.31 66.95 36.04 727.40 847.05 4120.8 0.2103
1969 391.25 164.48 174.96 68.26 39.09 838.04 823.50 4253.8 0.2230
1970 382.62 138.93 187.74 66.46 40.20 815.94 827.97 4283.5 0.2363
1971 342.32 106.33 187.87 65.95 40.43 742.91 834.35 4287.0 0.2519
1972 352.18 119.58 195.44 57.54 45.93 770.67 857.55 4380.3 0.2690
1973 364.44 127.61 222.79 57.39 42.45 814.68 867.30 4615.6 0.2833
1974 387.47 125.80 244.53 54.87 44.75 857.41 877.39 4688.3 0.3070
1975 361.66 120.04 249.80 48.91 44.32 824.73 982.07 4612.0 0.3384
1976 361.55 113.76 249.37 46.60 47.57 818.85 1021.41 4770.6 0.3640
1977 400.68 139.53 270.68 44.61 48.32 903.81 1040.21 5018.6 0.3934
1978 431.44 142.91 288.36 43.80 45.95 952.47 1093.55 5284.9 0.4195
1979 478.56 144.28 305.23 41.18 48.55 1017.80 1107.27 5493.6 0.4552
1980 485.32 128.45 313.79 48.38 52.32 1028.26 1175.07 5422.0 0.5029
1981 514.05 109.92 328.51 73.43 51.53 1077.44 1219.42 5492.1 0.5562
1982 499.74 82.59 338.20 60.94 55.40 1036.87 1251.67 5417.3 0.5958
1983 462.67 59.28 334.66 56.53 48.53 961.67 1294.42 5509.5 0.6245
1984 455.25 86.79 365.18 57.00 52.54 1016.76 1299.55 5858.4 0.6555
1985 493.34 90.45 391.04 53.08 54.67 1082.57 1395.66 6107.5 0.6781
1986 502.32 90.89 408.67 47.39 58.00 1107.26 1425.71 6351.5 0.6947
1987 549.57 117.49 424.64 45.44 58.93 1196.07 1405.69 6505.8 0.7143
1988 545.16 128.43 454.32 47.87 59.86 1235.63 1446.50 6806.1 0.7359
1989 584.05 135.36 470.99 45.06 63.43 1298.90 1498.92 7077.1 0.7631
1990 592.34 118.63 482.17 44.84 71.44 1309.43 1589.86 7276.6 0.7882
1991 568.72 119.24 481.42 51.55 61.71 1282.63 1609.93 7215.0 0.8226
1992 559.43 117.85 486.24 53.56 65.63 1282.71 1623.94 7334.2 0.8508
1993 584.16 134.69 490.89 55.08 58.35 1323.18 1615.50 7536.4 0.8725
1994 610.04 157.70 518.39 62.04 65.81 1413.98 1642.22 7819.9 0.8902
1995 647.20 172.15 531.22 63.03 68.78 1482.38 1662.15 8032.7 0.9120
1996 703.71 184.20 546.11 57.91 65.94 1557.87 1673.04 8248.4 0.9328
1997 775.63 191.73 567.28 59.87 66.65 1661.15 1684.17 8605.8 0.9508
1998 862.84 196.48 595.47 60.06 78.30 1793.14 1721.01 8984.6 0.9603
1999 902.22 189.45 627.65 72.23 83.34 1874.89 1746.04 9361.2 0.9748
2000 1004.46 207.29 652.85 68.87 91.99 2025.46 1789.22 9709.8 1.0000
2001 971.60 147.62 678.10 64.72 83.85 1945.89 1820.59 9827.9 1.0234
2002 823.35 142.01 672.19 64.26 76.03 1777.84 1929.16 9954.3 1.0425
2003 741.57 123.12 666.15 63.09 71.52 1665.45 2018.24 10098.7 1.0703
2004 734.55 171.95 665.95 63.43 71.45 1707.33 2082.09 10458.1 1.1013
2005 812.85 243.96 696.17 64.08 71.13 1888.19 2167.27 10752.9 1.1407
2006 883.40 299.50 709.00 62.59 82.63 2037.11 2247.13 11052.8 1.1817
2007* 967.83 283.23 723.17 47.25 81.77 2103.25 2305.43 11394.6 1.2077
2008* 1005.98 254.15 748.22 54.96 85.23 2148.54 2341.72 11713.2 1.2392
2009* 1048.39 251.88 767.28 49.68 86.69 2203.91 2351.32 12055.1 1.2697
2010* 1099.72 250.58 792.51 48.97 83.18 2274.96 2347.62 12405.6 1.2988
2011* 1142.80 256.52 817.72 51.67 68.84 2337.54 2378.04 12757.2 1.3277
2012* 1206.29 270.24 839.36 52.57 69.32 2437.77 2392.80 13109.8 1.3567
------------------------------------------------------------------------------- --------
RECEIPTS BY SOURCE, OUTLAYS, GDP, AND SELECTED TAX RATES: 1940-2010
(percent of GDP^)
Top
Individ Corporate Social Excise Total Total Marginal FICA
Year Income Income Insurance Tax Other Receipts Outlays Rate^ Rate^
---- --------- --------- --------- -------- -------- -------- -------- -------- --------
1940 0.92 1.24 1.84 2.04 0.72 6.76 9.78 81.10 1.00
1941 1.15 1.86 1.70 2.24 0.68 7.64 11.97 81.00 1.00
1942 2.26 3.27 1.70 2.36 0.56 10.14 24.35 88.00 1.00
1943 3.61 5.30 1.69 2.27 0.44 13.31 43.57 88.00 1.00
1944 9.42 7.09 1.66 2.27 0.46 20.91 43.64 94.00 1.00
1945 8.30 7.22 1.56 2.83 0.49 20.40 41.88 94.00 1.00
1946 7.23 5.34 1.40 3.14 0.54 17.65 24.80 86.45 1.00
1947 7.69 3.69 1.47 3.09 0.57 16.52 14.79 86.45 1.00
1948 7.54 3.78 1.47 2.87 0.57 16.23 11.63 82.13 1.00
1949 5.74 4.13 1.39 2.77 0.51 14.54 14.32 82.13 1.00
1950 5.77 3.83 1.59 2.77 0.49 14.45 15.59 84.36 1.50
1951 6.74 4.40 1.77 2.70 0.49 16.10 14.20 91.00 1.50
1952 8.01 6.09 1.85 2.54 0.49 18.98 19.42 92.00 1.50
1953 8.00 5.70 1.83 2.65 0.50 18.67 20.41 92.00 1.50
1954 7.83 5.59 1.91 2.64 0.50 18.47 18.78 91.00 2.00
1955 7.29 4.53 1.99 2.31 0.47 16.59 17.35 91.00 2.00
1956 7.53 4.89 2.18 2.32 0.53 17.46 16.54 91.00 2.00
1957 7.91 4.70 2.22 2.34 0.59 17.76 17.01 91.00 2.25
1958 7.54 4.36 2.44 2.31 0.64 17.29 17.89 91.00 2.25
1959 7.47 3.52 2.38 2.15 0.59 16.12 18.74 91.00 2.50
1960 7.86 4.15 2.84 2.25 0.76 17.86 17.80 91.00 3.00
1961 7.79 3.95 3.10 2.23 0.72 17.78 18.41 91.00 3.00
1962 8.03 3.62 3.00 2.21 0.70 17.56 18.82 91.00 3.125
1963 7.95 3.60 3.31 2.20 0.73 17.80 18.59 91.00 3.625
1964 7.60 3.67 3.43 2.14 0.74 17.58 18.51 77.00 3.625
1965 7.10 3.71 3.24 2.12 0.84 17.00 17.21 70.00 3.625
1966 7.36 3.99 3.39 1.73 0.89 17.38 17.87 70.00 4.20
1967 7.58 4.18 4.02 1.69 0.86 18.33 19.40 70.00 4.40
1968 7.93 3.31 3.91 1.62 0.87 17.65 20.56 75.25 4.40
1969 9.20 3.87 4.11 1.60 0.92 19.70 19.36 77.00 4.80
1970 8.93 3.24 4.38 1.55 0.94 19.05 19.33 71.75 4.80
1971 7.98 2.48 4.38 1.54 0.94 17.33 19.46 70.00 5.20
1972 8.04 2.73 4.46 1.31 1.05 17.59 19.58 70.00 5.20
1973 7.90 2.76 4.83 1.24 0.92 17.65 18.79 70.00 5.85
1974 8.26 2.68 5.22 1.17 0.95 18.29 18.71 70.00 5.85
1975 7.84 2.60 5.42 1.06 0.96 17.88 21.29 70.00 5.85
1976 7.58 2.38 5.23 0.98 1.00 17.16 21.41 70.00 5.85
1977 7.98 2.78 5.39 0.89 0.96 18.01 20.73 70.00 5.85
1978 8.16 2.70 5.46 0.83 0.87 18.02 20.69 70.00 6.05
1979 8.71 2.63 5.56 0.75 0.88 18.53 20.16 70.00 6.13
1980 8.95 2.37 5.79 0.89 0.96 18.96 21.67 70.00 6.13
1981 9.36 2.00 5.98 1.34 0.94 19.62 22.20 69.125 6.65
1982 9.22 1.52 6.24 1.13 1.02 19.14 23.11 50.00 6.70
1983 8.40 1.08 6.07 1.03 0.88 17.45 23.49 50.00 6.70
1984 7.77 1.48 6.23 0.97 0.90 17.36 22.18 50.00 6.70
1985 8.08 1.48 6.40 0.87 0.90 17.73 22.85 50.00 7.05
1986 7.91 1.43 6.43 0.75 0.91 17.43 22.45 50.00 7.15
1987 8.45 1.81 6.53 0.70 0.91 18.38 21.61 38.50 7.15
1988 8.01 1.89 6.68 0.70 0.88 18.15 21.25 28.00 7.51
1989 8.25 1.91 6.66 0.64 0.90 18.35 21.18 28.00 7.51
1990 8.14 1.63 6.63 0.62 0.98 18.00 21.85 28.00 7.65
1991 7.88 1.65 6.67 0.71 0.86 17.78 22.31 31.00 7.65
1992 7.63 1.61 6.63 0.73 0.89 17.49 22.14 31.00 7.65
1993 7.75 1.79 6.51 0.73 0.77 17.56 21.44 39.60 7.65
1994 7.80 2.02 6.63 0.79 0.84 18.08 21.00 39.60 7.65
1995 8.06 2.14 6.61 0.78 0.86 18.45 20.69 39.60 7.65
1996 8.53 2.23 6.62 0.70 0.80 18.89 20.28 39.60 7.65
1997 9.01 2.23 6.59 0.70 0.77 19.30 19.57 39.60 7.65
1998 9.60 2.19 6.63 0.67 0.87 19.96 19.16 39.60 7.65
1999 9.64 2.02 6.70 0.77 0.89 20.03 18.65 39.60 7.65
2000 10.34 2.13 6.72 0.71 0.95 20.86 18.43 39.60 7.65
2001 9.89 1.50 6.90 0.66 0.85 19.80 18.52 39.10 7.65
2002 8.27 1.43 6.75 0.65 0.76 17.86 19.38 38.60 7.65
2003 7.34 1.22 6.60 0.62 0.71 16.49 19.99 35.00 7.65
2004 7.02 1.64 6.37 0.61 0.68 16.33 19.91 35.00 7.65
2005 7.56 2.27 6.47 0.60 0.66 17.56 20.16 35.00 7.65
2006 7.99 2.71 6.41 0.57 0.75 18.43 20.33 35.00 7.65
2007* 8.49 2.49 6.35 0.41 0.72 18.46 20.23 35.00 7.65
2008* 8.59 2.17 6.39 0.47 0.73 18.34 19.99 35.00 7.65
2009* 8.70 2.09 6.36 0.41 0.72 18.28 19.50 35.00 7.65
2010* 8.86 2.02 6.39 0.39 0.67 18.34 18.92 35.00 7.65
2011* 8.96 2.01 6.41 0.40 0.54 18.32 18.64 35.00 7.65
2012* 9.20 2.06 6.40 0.40 0.53 18.60 18.25 35.00 7.65
----------------------------------------------------------------------------------------
* estimated
^ tax rates are in actual percent
Source: Budget of the United States Government, FY 2008, Historical Tables,
tables 1.1, 2.1, and 10.1; Top Marginal Rates - IRS Data Release,
Personal Exemptions and Individual Income Tax Rates, 1913-2002
(online at http://www.irs.gov/pub/irs-soi/02inpetr.pdf);
FICA Rates - 1994 Mercer Guide to Social Security & Medicare
Note: FICA Rates shown are paid by both the employer and employee
================================================================================
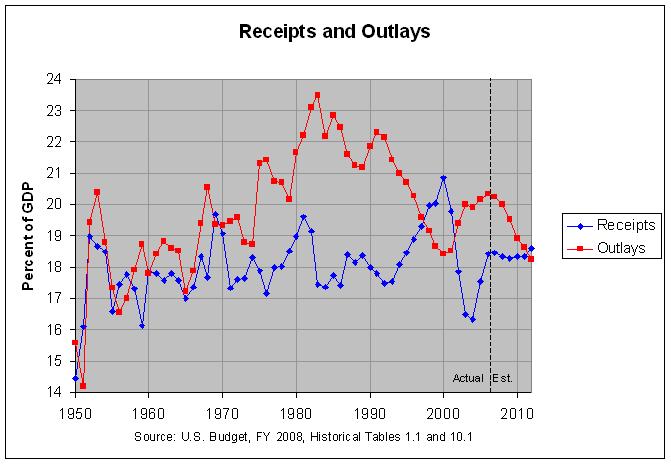
Among the points that the above tables illustrate are the following:
1) From 2000 to 2004, the budget went from a $236 billion surplus to a $413
billion deficit. Most of this increase in the deficit was due to the
fact that receipts dropped from 20.9% of GDP to 16.3% of GDP, their
lowest level since 1959. Meanwhile, outlays rose from 18.4% of GDP to
19.9% of GDP. The drop in receipts of 4.6% of GDP was over three times
the rise in outlays of 1.5% of GDP.
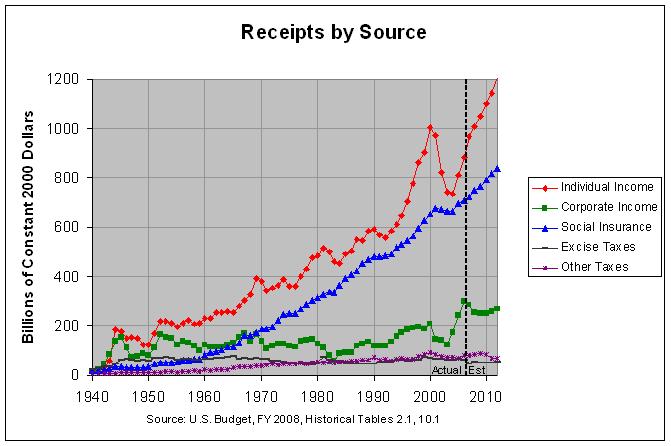
2) The largest drop in receipts was to individual income taxes. From 2000
to 2004, they dropped from 10.34% of GDP to 7.02% of GDP, their lowest
level since 1951. This drop of 3.32% of GDP was about 72% of the total
drop in receipts.
3) The second largest drop in receipts was to corporate income taxes.
From 2000 to 2003, they went down from 2.13% of GDP to 1.22% of GDP, a
drop of 0.91% of GDP. In 2004, however, they recovered nearly half of
that loss to a total drop of 0.49% of GDP. That was about 11% of the
total drop in receipts.
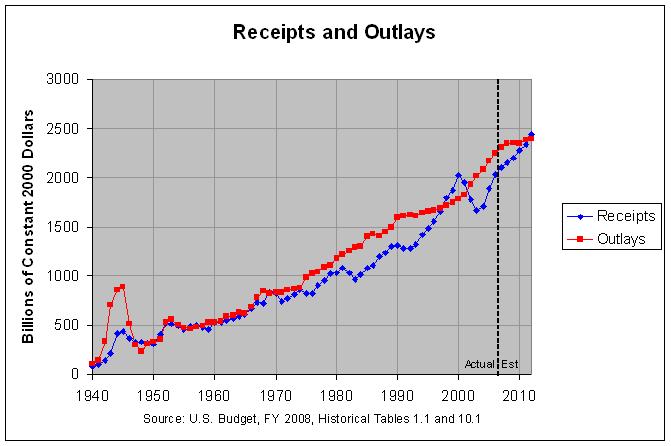
4) From 2004 to 2006, receipts rose from 16.3% of GDP to 18.4% of GDP,
recovering about 46% of their 2000 to 2004 loss. Measured in constant
2000 dollars, receipts dropped from $2025 billion in 2000 to $1707
billion in 2004 and then rose back to $2037 billion in 2006, slightly
surpassing their 2000 level.
5) From 2004 to 2006, receipts from individual income taxes rose to 7.99%
of GDP, recovering about 29% of their 2000 to 2004 loss. Measured in
constant 2000 dollars, those receipts dropped from $1004 billion in
2000 to $735 billion in 2004 and then rose back to $884 billion in
2006, recovering about 55% of their 2000 to 2004 loss.
6) From 2003 to 2006, receipts from corporate income taxes rose to 2.71%
of GDP, surpassing their 2000 level of 2.13% of GDP. In constant 2000
dollars, those receipts dropped from $207 billion in 2000 to $123
billion in 2003 and then rose to $300 billion in 2006, well surpassing
their 2000 level.
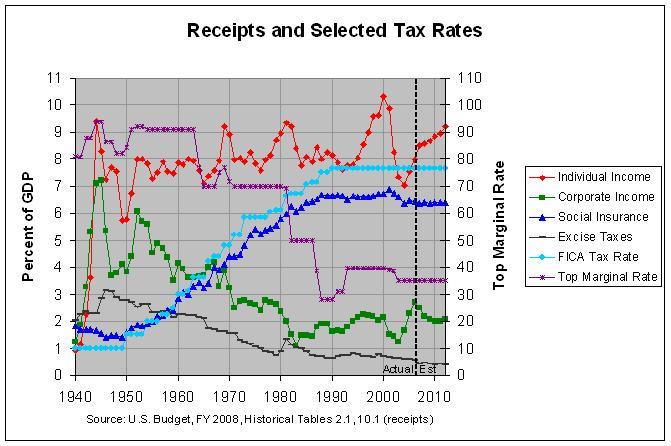
7) Since 1952, total receipts have remained fairly stable, ranging between
16 and 20 percent of GDP in all but two years. Individual income tax
receipts have likewise remained fairly stable, ranging between 7 and 10
percent of GDP in all but one year. From 1952 to 1990, however,
corporate income tax receipts dropped 4.46% of GDP (from 6.09 to 1.63)
and excise tax receipts dropped 1.92% of GDP (from 2.54 to 0.62). This
drop in receipts was largely offset by social insurance tax receipts
which rose 4.78% of GDP (from 1.85 to 6.63).
It should be noted that the great majority of social insurance tax
receipts come from the FICA tax, half of which is paid by the employer.
Hence, the share of all taxes that is paid by corporations has arguably
not dropped as much as the corporate income tax receipts shown above
might suggest.
Go to Budget Home Page
