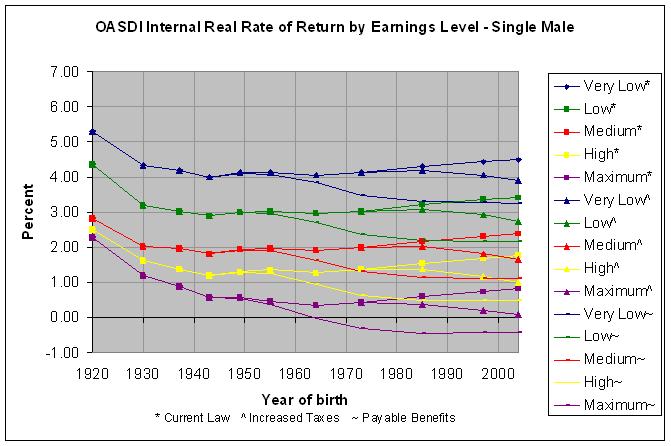

OASDI Internal Real Rates of Return for Single Males with Selected Earnings Levels
Present Law Scheduled Scenario Increased Payroll Tax Scenario Payable Benefits Scenario
Year Year -------------------------------------- -------------------------------------- --------------------------------------
of attains Very Very Very
birth age 65 Low Low Medium High Maximum Low Low Medium High Maximum Low Low Medium High Maximum
----- ------- ------ ------- ------- ------- ------- ------ ------- ------- ------- ------- ------ ------- ------- ------- -------
1920 1985 5.31 4.36 2.82 2.52 2.26 5.31 4.36 2.82 2.52 2.26 5.31 4.36 2.82 2.52 2.26
1930 1995 4.33 3.18 2.04 1.61 1.18 4.33 3.18 2.04 1.61 1.18 4.33 3.18 2.04 1.61 1.18
1937 2002 4.18 3.04 1.97 1.39 0.90 4.18 3.04 1.97 1.39 0.90 4.18 3.04 1.97 1.39 0.90
1943 2008 4.01 2.88 1.82 1.18 0.57 4.01 2.88 1.82 1.18 0.57 4.01 2.88 1.82 1.18 0.57
1949 2014 4.13 3.00 1.95 1.30 0.57 4.13 3.00 1.95 1.30 0.57 4.12 2.99 1.93 1.28 0.54
1955 2020 4.14 3.03 1.98 1.34 0.47 4.14 3.03 1.98 1.34 0.47 4.09 2.97 1.91 1.25 0.37
1964 2029 4.06 2.96 1.91 1.27 0.34 4.06 2.96 1.91 1.27 0.34 3.83 2.69 1.61 0.95 -0.02
1973 2038 4.13 3.04 2.00 1.37 0.43 4.13 3.04 2.00 1.37 0.43 3.50 2.36 1.29 0.63 -0.33
1985 2050 4.30 3.21 2.17 1.54 0.59 4.20 3.08 2.02 1.37 0.38 3.31 2.19 1.14 0.49 -0.45
1997 2062 4.44 3.35 2.31 1.68 0.74 4.05 2.91 1.82 1.16 0.20 3.27 2.17 1.12 0.49 -0.44
2004 2069 4.50 3.41 2.37 1.75 0.80 3.88 2.74 1.66 1.01 0.08 3.24 2.15 1.12 0.49 -0.43
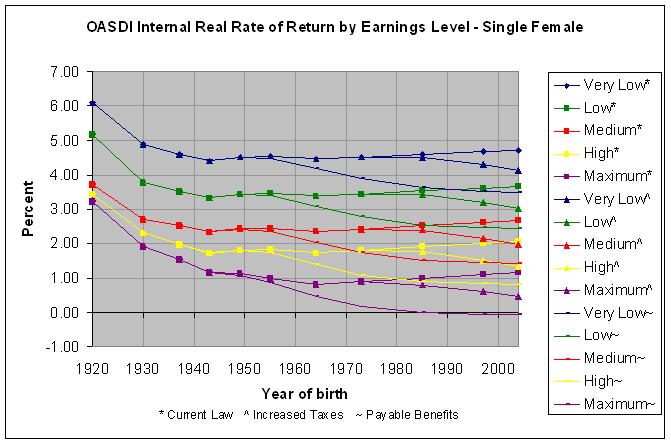
OASDI Internal Real Rates of Return for Single Females with Selected Earnings Levels
Present Law Scheduled Scenario Increased Payroll Tax Scenario Payable Benefits Scenario
Year Year -------------------------------------- -------------------------------------- --------------------------------------
of attains Very Very Very
birth age 65 Low Low Medium High Maximum Low Low Medium High Maximum Low Low Medium High Maximum
----- ------- ------ ------- ------- ------- ------- ------ ------- ------- ------- ------- ------ ------- ------- ------- -------
1920 1985 6.08 5.19 3.73 3.45 3.22 6.08 5.19 3.73 3.45 3.22 6.08 5.19 3.73 3.45 3.22
1930 1995 4.88 3.78 2.71 2.30 1.92 4.88 3.78 2.71 2.30 1.92 4.88 3.78 2.71 2.30 1.92
1937 2002 4.61 3.53 2.52 1.97 1.54 4.61 3.53 2.52 1.97 1.54 4.61 3.53 2.52 1.97 1.54
1943 2008 4.41 3.33 2.33 1.72 1.16 4.41 3.33 2.33 1.72 1.16 4.40 3.33 2.33 1.71 1.16
1949 2014 4.52 3.44 2.44 1.81 1.12 4.52 3.44 2.44 1.81 1.12 4.50 3.42 2.41 1.78 1.08
1955 2020 4.54 3.47 2.46 1.84 1.00 4.54 3.47 2.46 1.84 1.00 4.47 3.39 2.36 1.73 0.87
1964 2029 4.45 3.38 2.36 1.74 0.83 4.45 3.38 2.36 1.74 0.83 4.20 3.09 2.04 1.40 0.45
1973 2038 4.52 3.45 2.43 1.82 0.90 4.52 3.45 2.43 1.82 0.90 3.88 2.77 1.72 1.08 0.15
1985 2050 4.60 3.54 2.53 1.92 0.99 4.50 3.42 2.39 1.76 0.80 3.63 2.54 1.52 0.90 -0.02
1997 2062 4.68 3.62 2.62 2.01 1.09 4.31 3.20 2.15 1.52 0.59 3.53 2.47 1.46 0.85 -0.05
2004 2069 4.72 3.66 2.66 2.05 1.14 4.12 3.02 1.98 1.35 0.45 3.49 2.44 1.44 0.83 -0.06
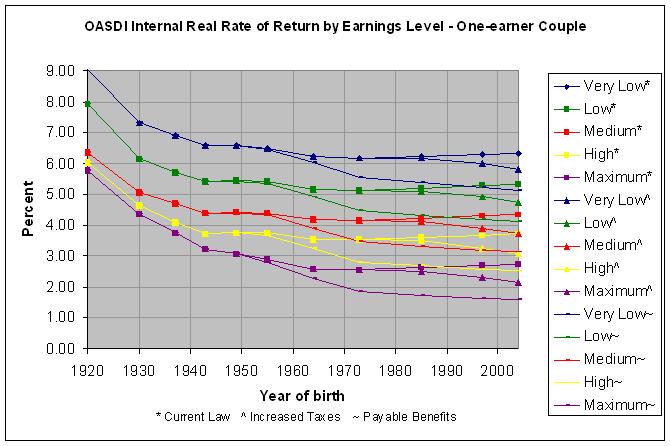
OASDI Internal Real Rates of Return for One-earner Couples with Selected Earnings Levels
Present Law Scheduled Scenario Increased Payroll Tax Scenario Payable Benefits Scenario
Year Year -------------------------------------- -------------------------------------- --------------------------------------
of attains Very Very Very
birth age 65 Low Low Medium High Maximum Low Low Medium High Maximum Low Low Medium High Maximum
----- ------- ------ ------- ------- ------- ------- ------ ------- ------- ------- ------- ------ ------- ------- ------- -------
1920 1985 9.04 7.92 6.37 6.01 5.78 9.04 7.92 6.37 6.01 5.78 9.04 7.92 6.37 6.01 5.78
1930 1995 7.31 6.14 5.06 4.63 4.36 7.31 6.14 5.06 4.63 4.36 7.31 6.14 5.06 4.63 4.36
1937 2002 6.91 5.72 4.69 4.10 3.76 6.91 5.72 4.69 4.10 3.76 6.91 5.72 4.69 4.10 3.76
1943 2008 6.58 5.41 4.39 3.72 3.23 6.58 5.41 4.39 3.72 3.23 6.58 5.41 4.39 3.72 3.23
1949 2014 6.57 5.43 4.42 3.76 3.08 6.57 5.43 4.42 3.76 3.08 6.56 5.42 4.40 3.74 3.06
1955 2020 6.49 5.40 4.39 3.75 2.88 6.49 5.40 4.39 3.75 2.88 6.44 5.34 4.32 3.67 2.79
1964 2029 6.24 5.17 4.18 3.54 2.58 6.24 5.17 4.18 3.54 2.58 6.03 4.93 3.90 3.25 2.26
1973 2038 6.17 5.13 4.15 3.52 2.56 6.17 5.13 4.15 3.52 2.56 5.55 4.47 3.46 2.81 1.85
1985 2050 6.23 5.19 4.22 3.60 2.63 6.17 5.11 4.12 3.49 2.49 5.37 4.31 3.32 2.69 1.73
1997 2062 6.30 5.27 4.29 3.67 2.71 6.00 4.92 3.91 3.27 2.30 5.22 4.18 3.20 2.58 1.64
2004 2069 6.32 5.30 4.32 3.71 2.74 5.80 4.73 3.72 3.08 2.15 5.13 4.11 3.13 2.52 1.60
OASDI Internal Real Rates of Return for Two-earner Couples with Selected Earnings Levels
Present Law Scheduled Scenario Increased Payroll Tax Scenario Payable Benefits Scenario
Year Year -------------------------------------- -------------------------------------- --------------------------------------
of attains Very Very Very
birth age 65 Low Low Medium High Maximum Low Low Medium High Maximum Low Low Medium High Maximum
----- ------- ------ ------- ------- ------- ------- ------ ------- ------- ------- ------- ------ ------- ------- ------- -------
1920 1985 6.38 5.30 3.62 3.30 3.04 6.38 5.30 3.62 3.30 3.04 6.38 5.30 3.62 3.30 3.04
1930 1995 5.06 3.87 2.68 2.22 1.79 5.06 3.87 2.68 2.22 1.79 5.06 3.87 2.68 2.22 1.79
1937 2002 4.82 3.62 2.51 1.90 1.41 4.82 3.62 2.51 1.90 1.41 4.82 3.62 2.51 1.90 1.41
1943 2008 4.57 3.38 2.30 1.63 1.02 4.57 3.38 2.30 1.63 1.02 4.56 3.37 2.30 1.63 1.02
1949 2014 4.60 3.44 2.38 1.71 0.97 4.60 3.44 2.38 1.71 0.97 4.58 3.43 2.35 1.69 0.94
1955 2020 4.57 3.45 2.38 1.73 0.85 4.57 3.45 2.38 1.73 0.85 4.51 3.38 2.30 1.63 0.74
1964 2029 4.46 3.35 2.29 1.64 0.69 4.46 3.35 2.29 1.64 0.69 4.22 3.08 1.98 1.31 0.33
1973 2038 4.50 3.40 2.35 1.71 0.76 4.50 3.40 2.35 1.71 0.76 3.87 2.73 1.64 0.98 0.01
1985 2050 4.60 3.52 2.48 1.84 0.88 4.50 3.39 2.33 1.68 0.68 3.65 2.54 1.48 0.83 -0.11
1997 2062 4.70 3.62 2.58 1.95 1.00 4.30 3.18 2.10 1.43 0.47 3.53 2.45 1.41 0.78 -0.15
2004 2069 4.74 3.67 2.63 2.00 1.05 4.11 2.99 1.92 1.27 0.34 3.47 2.40 1.37 0.75 -0.17
Source: Actuarial Note 2005.5, Social Security Administration,
Internal Real Rates of Return under the OASDI Program for Hypothetical Workers,
http://www.ssa.gov/OACT/NOTES/ran5/index.html
Notes: 1. OASDI refers to the Old-Age, Survivors, and Disability Insurance program.
2. For very low, low, medium, and high income earners, the career-average level of earnings is assumed
to be about equal to 25, 45, 100, and 160 percent of the AWI (Average Wage Index), respectively.
3. The internal real rate of return is the real interest rate (effective real annual yield) for which
the present value of expected payroll taxes (contributions) is equal to the present value of
expected benefits. Therefore, internal rates of return represent an attempt to answer the question:
If the contributions of a group of workers with selected characteristics were invested to fund the
future benefits of those workers and their dependents, at what real annual yield would the
contributions need to be invested?
Go to Budget Home Page
