MEDIAN FAMILY NET WORTH, BY SELECTED CHARACTERISTICS OF FAMILIES, 1989-2010 SURVEYS
(thousands of 2010 dollars) percent
change
Family Characteristics 1989 1992 1995 1998 2001 2004 2007 2010 07-10
------------------------ ------ ------ ------ ------ ------ ------ ------ ------ ------
All Families 79.1 75.1 81.9 95.6 106.1 107.2 126.4 77.3 -38.8
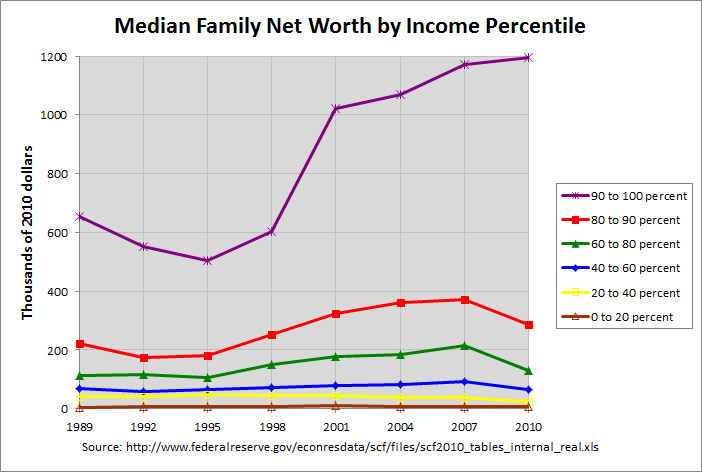
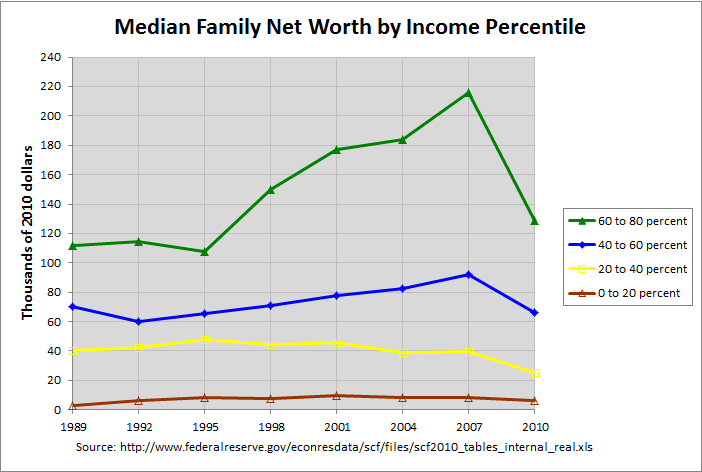
Percentile of income
Less than 20 3.0 6.0 8.5 7.8 9.6 8.6 8.5 6.2 -27.1
20-39.9 40.6 42.1 47.5 44.2 45.9 38.8 39.6 25.6 -35.4
40-59.9 70.2 60.0 65.7 71.2 78.0 82.8 92.3 65.9 -28.6
60-79.9 112.1 114.8 107.7 149.8 176.8 184.0 215.7 128.6 -40.4
80-89.9 222.6 175.4 181.4 251.4 322.4 360.9 373.2 286.6 -23.2
90-100 655.2 551.4 503.6 603.4 1021.5 1069.7 1172.3 1194.3 1.9
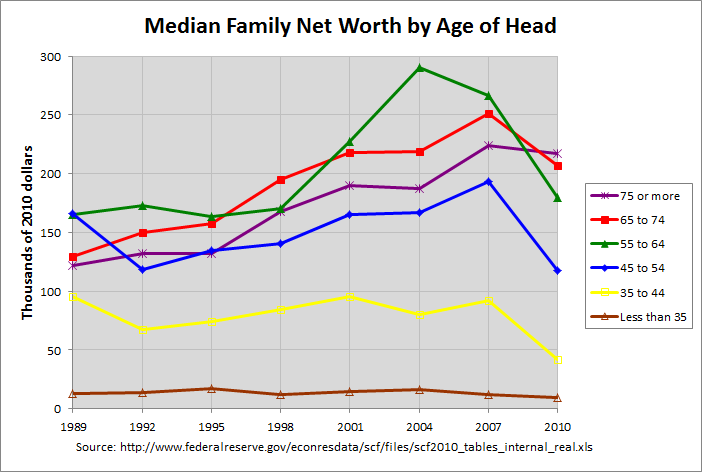
Age of head (years)
Less than 35 13.2 14.0 17.0 12.2 14.3 16.3 12.4 9.3 -25.0
35-44 95.2 67.7 74.0 84.6 95.1 79.9 92.4 42.1 -54.4
45-54 166.5 118.6 134.4 140.9 164.9 167.1 193.7 117.9 -39.1
55-64 165.0 172.8 163.5 170.6 227.2 290.0 266.2 179.4 -32.6
65-74 129.3 149.6 157.2 195.4 217.8 218.8 250.8 206.7 -17.6
75 or more 122.2 131.7 131.7 167.5 190.3 187.7 223.7 216.8 -3.1
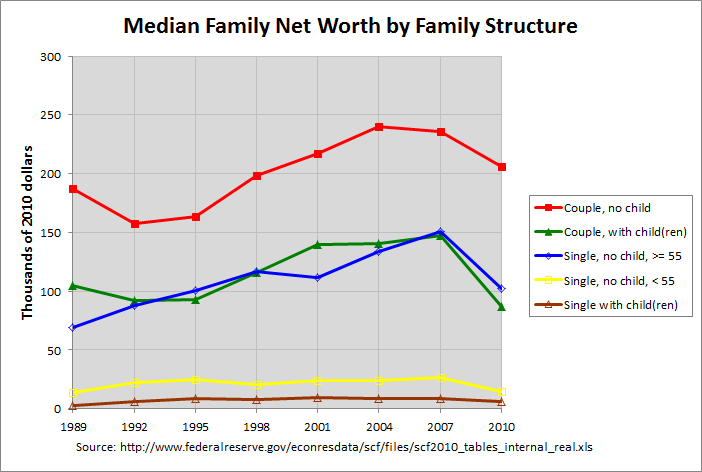
Family structure
Single with child(ren) 12.2 12.9 17.0 21.5 16.2 24.0 24.4 15.5 -36.5
Single, no child, < 55 13.7 22.6 24.8 20.6 24.0 24.2 26.3 14.6 -44.5
Single, no child, >= 55 69.0 88.2 100.2 116.4 111.9 134.0 150.7 102.0 -32.3
Couple with child(ren) 104.6 91.7 93.3 116.2 139.3 140.6 147.5 86.7 -41.2
Couple, no child 187.3 157.8 163.4 198.1 217.1 240.2 236.2 205.7 -12.9
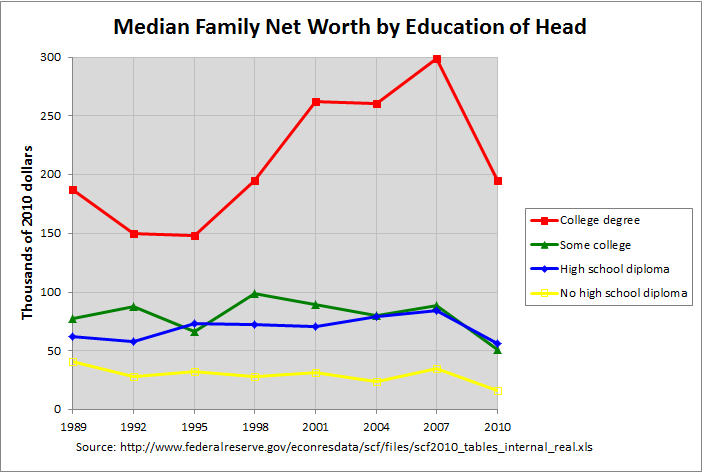
Education of head
No high school diploma 40.7 28.3 32.1 28.1 31.3 23.7 34.8 16.1 -53.7
High school diploma 62.1 58.3 73.5 72.1 71.1 79.1 84.3 56.7 -32.7
Some college 77.5 87.5 66.3 98.5 89.8 79.8 88.8 50.9 -42.7
College degree 187.3 149.8 147.9 195.3 262.2 260.2 298.6 195.2 -34.6
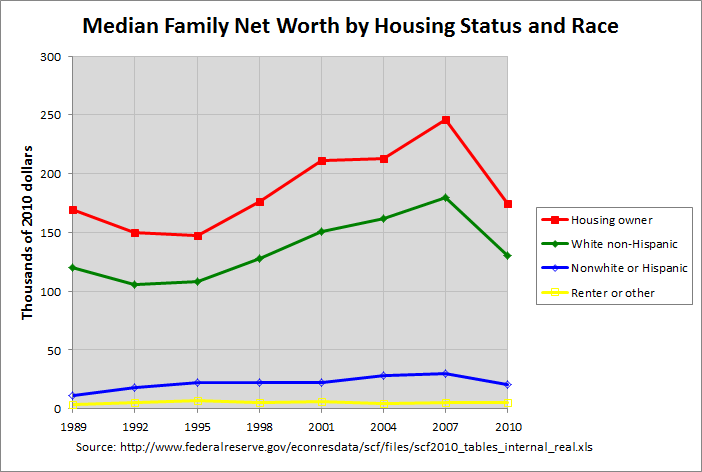
Race or ethnicity of respondent
White non-Hispanic 120.0 105.7 108.5 127.8 150.4 162.2 179.4 130.5 -27.3
Nonwhite or Hispanic 11.3 18.2 22.4 22.2 22.0 28.5 29.7 20.4 -31.3
Current work status of head
Working for someone else 64.1 59.9 69.6 70.4 79.7 77.4 98.5 55.2 -44.0
Self-employed 286.1 218.7 220.7 331.4 431.7 402.2 407.3 285.6 -29.9
Retired 111.5 106.8 114.9 150.8 141.0 160.9 169.9 151.1 -11.1
Other not working 1.3 5.0 5.1 4.7 9.4 13.6 6.0 11.9 98.3
Current occupation of head
Managerial, professional 183.1 153.6 156.6 176.5 242.1 227.3 258.8 167.3 -35.4
Technical, sales, srvcs 45.8 55.3 52.8 54.4 57.3 51.7 77.0 32.6 -57.7
Other occupation 62.4 49.7 63.9 66.7 58.9 65.0 68.4 46.6 -31.9
Retired, not working 74.5 75.8 88.3 109.2 118.2 127.9 135.6 93.5 -31.0
Region
Northeast 147.3 97.2 117.3 125.8 114.3 186.1 167.1 119.9 -28.2
Midwest 88.6 86.3 92.9 107.1 130.3 132.4 112.7 68.4 -39.3
South 59.5 52.4 62.5 81.7 90.4 73.4 102.0 68.2 -33.1
West 77.3 108.4 77.5 81.8 109.0 109.3 164.1 73.4 -55.3
Urbanicity
Metro statistical area 78.3 80.3 84.0 96.7 108.0 120.1 138.8 78.4 -43.5
Non-MSA 83.4 58.8 72.3 92.1 98.0 68.2 82.0 74.5 -9.1
Housing status
Owner 169.2 149.9 147.5 176.2 211.5 212.6 246.0 174.5 -29.1
Renter or other 3.3 4.9 6.9 5.7 5.9 4.6 5.4 5.1 -5.6
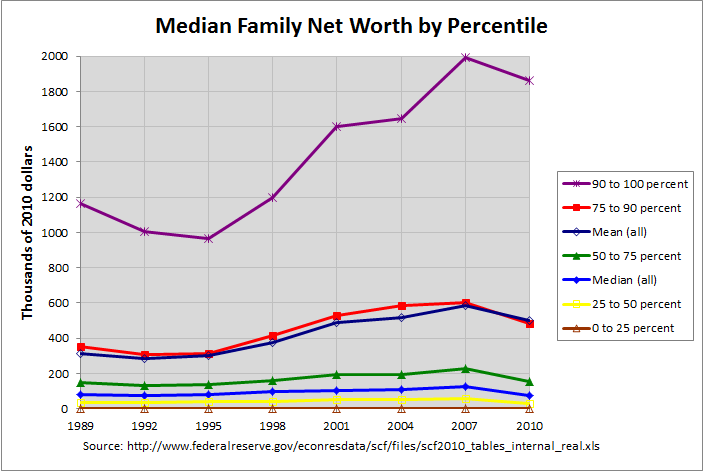
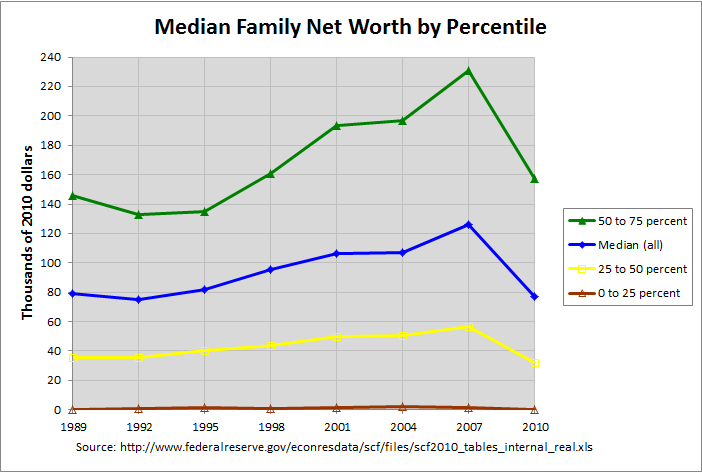
Percentile of net worth
Less than 25 0.3 0.8 1.3 0.7 1.4 2.0 1.3 0.0 -100.0
25-49.9 35.5 35.8 40.0 43.6 50.1 50.2 56.8 32.2 -43.3
50-74.9 146.1 132.8 134.7 160.7 193.6 196.7 230.8 157.2 -31.9
75-89.9 354.6 309.4 313.3 413.6 528.0 586.7 601.2 482.7 -19.7
90-100 1161.3 1007.9 967.8 1195.6 1602.6 1645.5 1991.9 1864.1 -6.4
------------------------------------------------------------------------------------------------
MEAN FAMILY NET WORTH, BY SELECTED CHARACTERISTICS OF FAMILIES, 1989-2010 SURVEYS
(thousands of 2010 dollars) percent
change
Family Characteristics 1989 1992 1995 1998 2001 2004 2007 2010 07-10
------------------------ ------ ------ ------ ------ ------ ------ ------ ------ ------
All Families 313.6 282.9 300.4 377.3 487.0 517.1 584.6 498.8 -14.7
Percentile of income
Less than 20 41.6 49.9 62.9 63.7 64.7 83.6 110.3 116.8 5.9
20-39.9 110.9 97.3 112.0 128.2 141.2 139.8 141.3 127.9 -9.5
40-59.9 170.9 153.4 144.9 168.7 199.4 224.0 220.6 199.0 -9.8
60-79.9 229.4 213.5 228.5 275.3 360.7 392.9 393.9 294.0 -25.4
80-89.9 375.1 343.3 364.7 434.8 560.3 563.7 638.1 567.3 -11.1
90-100 1654.9 1456.8 1541.8 2065.9 2777.1 2925.2 3474.7 2944.3 -15.3
Age of head (years)
Less than 35 79.0 68.8 61.2 85.2 111.2 84.6 111.1 65.3 -41.2
35-44 249.0 202.1 203.6 262.1 318.6 345.2 341.9 217.4 -36.4
45-54 466.2 407.6 420.2 485.3 595.9 625.8 694.6 573.0 -17.5
55-64 519.1 512.4 543.2 710.6 898.6 976.4 986.7 880.5 -10.8
65-74 471.9 434.4 493.9 622.6 831.4 795.1 1064.1 848.4 -20.3
75 or more 407.4 324.7 365.8 414.6 574.8 607.7 668.8 677.9 1.4
Family structure
Single with child(ren) 106.7 82.1 103.0 136.6 117.4 149.9 187.4 143.7 -23.3
Single, no child, < 55 122.4 107.4 102.8 123.0 185.5 179.8 217.2 117.5 -45.9
Single, no child, >= 55 206.9 236.5 280.3 328.2 355.8 405.8 408.9 391.6 -4.2
Couple with child(ren) 339.0 312.0 304.7 398.6 540.1 580.5 629.1 555.7 -11.7
Couple, no child 585.5 481.0 511.8 643.5 790.1 868.2 998.6 864.8 -13.4
Education of head
No high school diploma 140.1 106.3 119.3 105.2 127.5 157.1 149.7 110.7 -26.1
High school diploma 187.9 169.4 188.3 210.5 222.0 227.2 263.8 218.1 -17.3
Some college 314.4 260.0 267.4 317.3 352.1 355.7 384.5 272.2 -29.2
College degree 610.0 515.5 545.8 705.8 976.6 982.3 1154.5 977.7 -15.3
Race or ethnicity of respondent
White non-Hispanic 383.6 337.2 355.5 450.6 599.0 648.3 727.4 654.5 -10.0
Nonwhite or Hispanic 106.0 117.5 109.3 134.1 144.1 176.2 240.3 175.9 -26.8
Current work status of head
Working for someone else 191.8 185.6 194.2 224.5 276.9 310.7 369.1 298.8 -19.0
Self-employed 1099.0 909.6 993.0 1235.2 1546.5 1639.9 2057.4 1743.7 -15.2
Retired 308.2 287.7 318.9 410.2 556.4 539.8 569.1 485.3 -14.7
Other not working 66.2 80.5 80.7 98.7 218.4 186.7 130.1 137.5 5.7
Current occupation of head
Managerial, professional 640.0 569.9 610.2 722.8 942.4 995.6 1174.8 1047.0 -10.9
Technical, sales, srvcs 220.5 207.7 229.8 257.7 244.7 284.8 325.8 219.1 -32.8
Other occupation 181.5 132.6 158.3 168.7 167.1 169.8 201.3 162.8 -19.1
Retired, not working 257.8 238.6 270.5 357.9 501.4 485.0 500.6 410.4 -18.0
Region
Northeast 363.7 319.6 355.5 404.8 556.3 655.0 684.6 615.2 -10.1
Midwest 316.1 262.7 282.1 332.2 418.3 503.8 491.2 399.8 -18.6
South 221.8 213.6 264.3 356.5 461.4 401.0 525.9 440.8 -16.2
West 414.3 385.8 329.2 437.2 541.8 605.3 695.4 599.9 -13.7
Urbanicity
Metro statistical area 334.9 316.5 320.4 409.0 525.0 582.0 652.6 553.6 -15.2
Non-MSA 223.1 134.8 184.1 193.1 250.1 203.5 253.9 236.1 -7.0
Housing status
Owner 454.3 409.5 430.4 540.0 687.2 720.9 817.6 713.4 -12.7
Renter or other 64.8 58.7 62.0 57.9 67.7 62.3 74.7 57.2 -23.4
Percentile of net worth
Less than 25 -1.0 -0.9 -0.2 -2.5 0.1 -1.6 -2.3 -12.8 456.5
25-49.9 38.7 38.5 43.3 47.9 54.4 54.2 60.9 35.6 -41.5
50-74.9 150.1 137.3 141.1 171.5 204.9 213.7 238.6 168.9 -29.2
75-89.9 381.1 331.4 338.0 429.6 553.5 608.4 616.7 527.9 -14.4
90-100 2094.6 1894.2 2035.8 2586.1 3390.0 3591.1 4176.9 3716.4 -11.0
------------------------------------------------------------------------------------------------
Source: 2010 Survey of Consumer Finances, Internal Data, Table 4
Go to Budget Home Page
