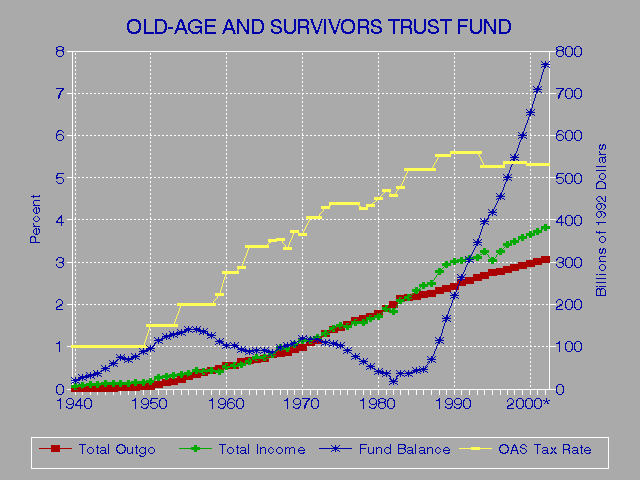
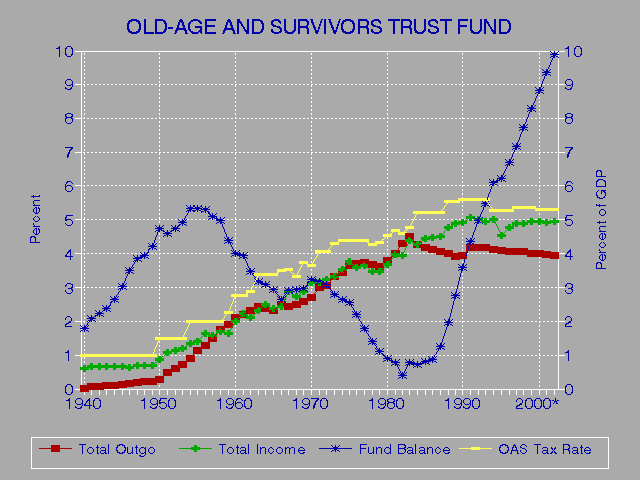
OLD-AGE AND SURVIVORS TRUST FUND - INCOME, OUTGO, AND BALANCE: 1940-2002
    (in billions of 1992 dollars - Maximum Earnings in 1992 dollars)
------------------------------------------------------------------------
                                                    Maximum Composite
                  Total    Total     Fund  OAS Tax Earnings   Outlay
Year      GDP     Outgo   Income  Balance     Rate    Taxed  Deflator
----   -------   ------   ------  -------  -------  -------  --------
1940    1128.0      0.3      6.8     20.1    1.00      3000   0.0867
1941    1269.5      1.0      8.2     26.4    1.00      3000   0.0909
1942    1381.2      1.3      9.2     30.7    1.00      3000   0.1052
1943    1531.5      1.5     10.4     36.4    1.00      3000   0.1174
1944    1868.9      2.0     12.6     49.2    1.00      3000   0.1106
1945    2022.3      2.5     13.3     61.5    1.00      3000   0.1075
1946    2086.2      3.4     13.3     73.2    1.00      3000   0.1044
1947    1829.5      3.7     13.0     70.4    1.00      3000   0.1249
1948    1980.5      4.4     14.1     78.5    1.00      3000   0.1280
1949    2095.6      5.1     15.0     87.9    1.00      3000   0.1286
1950    2045.0      5.9     17.8     96.7    1.50      3000   0.1333
1951    2473.0     12.1     26.3    113.5    1.50      3600   0.1298
1952    2615.7     15.5     29.5    124.3    1.50      3600   0.1335
1953    2586.1     18.9     31.1    127.5    1.50      3600   0.1440
1954    2525.8     22.5     33.8    134.2    2.00      3600   0.1493
1955    2605.4     29.2     36.5    139.3    2.00      4200   0.1518
1956    2662.9     34.2     43.3    141.0    2.00      4200   0.1602
1957    2643.4     39.2     41.7    135.3    2.00      4200   0.1702
1958    2550.3     44.7     43.5    126.8    2.00      4200   0.1799
1959    2554.5     48.9     42.3    112.4    2.25      4800   0.1917
1960    2576.0     55.0     51.5    103.6    2.75      4800   0.2012
1961    2572.3     56.9     57.3    101.5    2.75      4800   0.2062
1962    2718.3     63.6     57.6     94.2    2.875     4800   0.2087
1963    2768.0     67.1     64.0     87.7    3.375     4800   0.2164
1964    2909.5     69.5     73.0     89.8    3.375     4800   0.2199
1965    3084.0     71.7     73.7     90.7    3.375     4800   0.2227
1966    3279.7     81.8     80.4     86.7    3.50      6600   0.2295
1967    3428.6     83.3     98.7     99.4    3.55      6600   0.2368
1968    3515.6     87.6     95.8    103.5    3.325     7800   0.2469
1969    3638.1     94.7    104.9    108.2    3.725     7800   0.2606
1970    3650.6     98.8    114.8    118.0    3.65      7800   0.2765
1971    3665.9    109.8    115.6    116.9    4.05      7800   0.2939
1972    3768.8    114.8    121.4    116.6    4.05      9000   0.3123
1973    3984.1    133.0    133.0    111.1    4.30     10800   0.3280
1974    4054.4    139.5    143.6    106.8    4.375    13200   0.3547
1975    3964.5    144.5    149.8    101.9    4.375    14100   0.3921
1976    4121.0    153.1    148.4     90.5    4.375    15300   0.4199
1977    4342.3    161.8    158.1     77.9    4.375    16500   0.4540
1978    4555.5    167.2    158.1     63.8    4.275    17700   0.4857
1979    4738.8    171.1    165.0     52.7    4.33     22900   0.5267
1980    4672.5    177.4    171.9     42.2    4.52     25900   0.5819
1981    4748.6    190.5    189.3     37.1    4.70     29700   0.6421
1982    4677.8    200.9    184.5     18.3    4.575    32400   0.6865
1983    4755.9    214.0    209.3     37.1    4.775    35700   0.7195
1984    5052.4    215.2    216.5     36.5    5.20     37800   0.7545
1985    5239.6    219.2    232.8     43.3    5.20     39600   0.7829
1986    5433.9    223.1    243.9     46.6    5.20     42000   0.8050
1987    5566.4    225.8    250.8     70.4    5.20     43800   0.8273
1988    5796.3    231.6    276.8    113.5    5.53     45000   0.8546
1989    6011.9    236.1    293.7    166.6    5.53     48000   0.8902
1990    6140.8    242.5    302.0    219.8    5.60     51300   0.9257
1991    6043.1    251.4    305.1    263.5    5.60     53400   0.9695
1992    6143.2    256.3    307.2    306.3    5.60     55500   1.0000
1993    6311.7    263.3    311.5    346.9    5.60     57600   1.0252
1994    6510.1    268.4    326.2    396.8    5.26     60600   1.0492
1995    6688.6    274.1    303.5    416.9    5.26     61200   1.0745
1996    6809.8    277.9    324.8    454.4    5.26     62700   1.0991

1997*   6960.7    283.2    340.3    499.9    5.35     65400   1.1283
1998*   7091.7    287.1    348.4    548.0    5.35             1.1589
1999*   7236.8    291.3    357.8    600.1    5.35             1.1900
2000*   7398.9    295.8    365.3    653.7    5.30             1.2222
2001*   7568.2    301.2    372.9    708.6    5.30             1.2544
2002*   7747.3    306.6    382.4    766.8    5.30             1.2863
------------------------------------------------------------------------
*estimated
Source: Budget of the United States Government, FY 1998, Historical
        Tables, table 10.1 and 13.1; OAS Tax Rate and Maximum Earnings
        from 1996 Annual Report of the Board of Trustees of the OASDI
        Trust Fund, Table II.B1, page 33
Note: OAS Tax Rate is paid by employer and employee, each; after 1996,
      maximum earnings taxed is based on increases in average wages
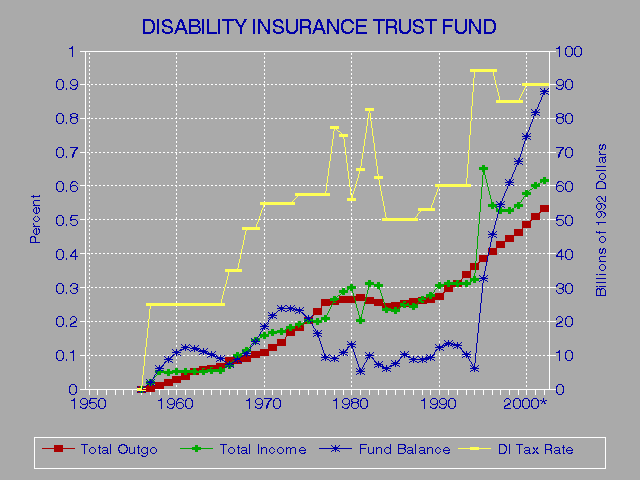
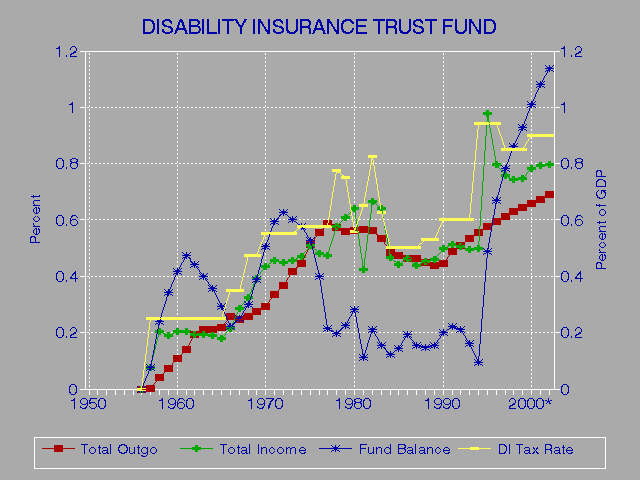
DISABILITY INSURANCE TRUST FUND - INCOME, OUTGO, AND BALANCE: 1957-2002
   (in billions of 1992 dollars - Maximum Earnings in 1992 dollars)
-----------------------------------------------------------------------
                                                    Maximum Composite
                  Total    Total     Fund   DI Tax Earnings   Outlay
Year      GDP     Outgo   Income  Balance     Rate    Taxed  Deflator
----   -------   ------   ------  -------   ------  -------  --------
1957    2643.4      0.0      2.0      2.0    0.25      4200   0.1702
1958    2550.3      1.0      5.2      6.1    0.25      4200   0.1799
1959    2554.5      1.9      4.8      8.7    0.25      4800   0.1917
1960    2576.0      2.8      5.3     10.8    0.25      4800   0.2012
1961    2572.3      3.6      5.3     12.1    0.25      4800   0.2062
1962    2718.3      5.2      5.2     12.0    0.25      4800   0.2087
1963    2768.0      5.8      5.3     11.1    0.25      4800   0.2164
1964    2909.5      6.1      5.5     10.3    0.25      4800   0.2199
1965    3084.0      6.7      5.6      9.0    0.25      4800   0.2227
1966    3279.7      8.4      7.0      7.4    0.35      6600   0.2295
1967    3428.6      8.4      9.8      8.5    0.35      6600   0.2368
1968    3515.6      9.1     11.3     10.5    0.475     7800   0.2469
1969    3638.1     10.0     14.2     14.1    0.475     7800   0.2606
1970    3650.6     10.7     15.8     18.5    0.55      7800   0.2765
1971    3665.9     12.3     16.7     21.8    0.55      7800   0.2939
1972    3768.8     13.8     16.9     23.7    0.55      9000   0.3123
1973    3984.1     16.7     18.1     24.0    0.55     10800   0.3280
1974    4054.4     18.0     19.1     23.3    0.575    13200   0.3547
1975    3964.5     20.4     20.2     20.9    0.575    14100   0.3921
1976    4121.0     22.9     19.9     16.5    0.575    15300   0.4199
1977    4342.3     25.5     20.6      9.4    0.575    16500   0.4540
1978    4555.5     26.1     26.3      9.0    0.775    17700   0.4857
1979    4738.8     26.5     28.9     10.7    0.75     22900   0.5267
1980    4672.5     26.3     29.9     13.2    0.56     25900   0.5819
1981    4748.6     26.9     20.2      5.3    0.65     29700   0.6421
1982    4677.8     26.3     31.2      9.8    0.825    32400   0.6865
1983    4755.9     25.4     30.4      7.4    0.625    35700   0.7195
1984    5052.4     24.5     23.6      6.2    0.50     37800   0.7545
1985    5239.6     24.7     23.1      7.5    0.50     39600   0.7829
1986    5433.9     25.1     25.1     10.4    0.50     42000   0.8050
1987    5566.4     25.7     24.3      8.7    0.50     43800   0.8273
1988    5796.3     26.2     26.3      8.5    0.53     45000   0.8546
1989    6011.9     26.4     27.6      9.4    0.53     48000   0.8902
1990    6140.8     27.3     30.6     12.4    0.60     51300   0.9257
1991    6043.1     29.5     31.1     13.4    0.60     53400   0.9695
1992    6143.2     31.3     31.2     12.9    0.60     55500   1.0000
1993    6311.7     33.8     31.3     10.1    0.60     57600   1.0252
1994    6510.1     36.2     32.5      6.1    0.94     60600   1.0492
1995    6688.6     38.5     65.3     32.8    0.94     61200   1.0745
1996    6809.8     40.5     54.1     45.6    0.94     62700   1.0991

1997*   6960.7     42.7     52.8     54.5    0.85     65400   1.1283
1998*   7091.7     44.6     52.7     61.1    0.85             1.1589
1999*   7236.8     46.5     54.1     67.2    0.85             1.1900
2000*   7398.9     48.7     57.8     74.6    0.90             1.2222
2001*   7568.2     50.9     60.1     81.8    0.90             1.2544
2002*   7747.3     53.3     61.6     88.1    0.90             1.2863
-----------------------------------------------------------------------
*estimated
Source: Budget of the United States Government, FY 1998, Historical
        Tables, table 10.1 and 13.1; DI Tax Rate and Maximum Earnings
        from 1996 Annual Report of the Board of Trustees of the OASDI
        Trust Fund, Table II.B1, page 33
Note: DI Tax Rate is paid by employer and employee, each; after 1996,
      maximum earnings taxed is based on increases in average wages
Among the points that the above graphs and tables illustrate are the
following:

1) Spending for Old-Age and Survivors Insurance (OAS) generally grew
   faster than the GDP up until 1983.  Since then, it has stabilized
   in relation to the GDP (but has continued to outpace inflation).

2) Spending for Disability Insurance (DI) generally grew faster than
   the GDP up until 1977, dropped from then until 1990, then resumed
   its faster-than-GDP growth.

3) Despite its recent growth, DI spending is still much lower than OAS
   spending.  In 1996, DI spending was about 14.6% of OAS spending.

4) The third graph shows a close correlation between the growth in OAS
   income as a percent of GDP and the OAS Tax Rate.  Likewise, the fourth
   graph shows a close correlation between the growth in DI income as a
   percent of GDP and the DI Tax Rate.  This may not be too surprising.
   Assuming that the wage base is growing at about the same rate as the
   GDP, then a constant tax rate should bring in the same percentage of
   GDP.  This implies that the main reason for the rising OAS and DI Tax
   Rates has been to support those programs' above GDP growth.

5) The OAS Trust Fund balance approached zero in 1982.  In 1983, $17.5
   billion was borrowed from other trust funds (it was repaid in 1985 and
   1986), COLAs were deferred for six months, and various other steps
   were taken to shore up the fund.

6) The DI Trust Fund balance approached zero in 1994.  The percentage
   of OASDI taxes allocated to DI was increased to shore up the fund.
Go to Budget Home Page