The argument that the near-doubling of revenues during Reagan's two terms proves the value of tax cuts is an old argument. It's also extremely flawed. At 99.6 percent, revenues did nearly double during the 80s. However, they had likewise doubled during EVERY SINGLE DECADE SINCE THE GREAT DEPRESSION! They went up 502.4% during the 40's, 134.5% during the 50's, 108.5% during the 60's, and 168.2% during the 70's. At 96.2 percent, they nearly doubled in the 90s as well. Hence, claiming that the Reagan tax cuts caused the doubling of revenues is like a rooster claiming credit for the dawn.
Furthermore, the receipts from individual income taxes (the only receipts directly affected by the tax cuts) went up only 91.3 percent during the 80's. Meanwhile, receipts from Social Insurance, which is directly affected by the FICA tax rate, went up 140.8 percent. This large increase was largely due to the fact that the FICA tax rate went up 25% from 6.13 to 7.65 percent of payroll. Hence, the claim that the doubling of TOTAL revenues proves the effectiveness of tax cuts is including revenues which resulted from a tax hike to prove the effectiveness of a tax cut. This seems like the height of hypocrisy.
Hence, what evidence there is suggests there to be a correlation between lower taxes and LOWER revenues, not HIGHER revenues as suggested by supply-siders. There may well be valid arguments in favor of tax cuts. But higher tax revenues does not appear to be one of them.
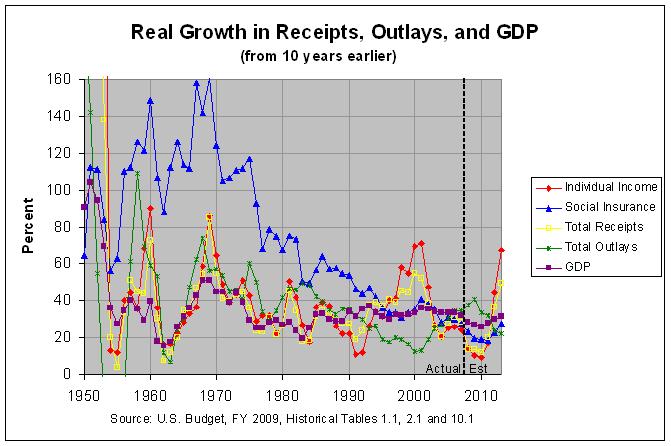
The argument that the near-doubling of revenues during Reagan's two terms proves the value of tax cuts is an old argument. It's also extremely flawed. The growth of receipts by source, outlays, and GDP over every 10-year period since 1940 is shown in the following graph:
The actual numbers and sources can be found at recgro09.html. As can be seen in the first table, total receipts increased 76.06 percent from 1981 to 1991. However, this was the slowest 10-year growth rate since a 75.41 percent growth in total receipts from 1956 to 1966. Of course, these results are likely skewed by the high inflation that occurred during the 70's. Hence, it makes more sense to look at the "real" growth rates, that is, the growth rates corrected for inflation. The second table shows that the real growth rate from 1981 to 1991 was 19.04%. The 10-year growth rate increased in the following years to a high of 39.07% from 1984 to 1994. However, the real growth rate of total receipts reached higher highs of 45.03% in 1971 to 1981 and 54.68% from 1990 to 2000.
Another serious flaw in the doubling of revenues argument is that it looks at all revenues. The FICA tax rate increased from 6.13 percent in 1980 to 7.65 percent in 1990. To include an increase in revenues gained through a tax hike in order to argue in favor of tax cuts would seem extremely hypocritical. Hence, we need to look only at revenues obtained from individual income taxes. According to the second table, the real growth in individual income tax receipts was 10.63% from 1981 to 1991 and 11.94% from 1982 to 1992. These were the lowest growth rates of any of the 58 10-year spans from 1940 to 2007. Incidentally, these record lows are projected to be surpassed by 1999 to 2009 (10.11%) and 2000 to 2010 (9.18%).
Hence, the evidence is that the Reagan tax cuts DECREASED revenues over what they would have been, at least over the short (10-year) term. The only remaining argument in favor of the Reagan tax cuts, at least from a revenue point of view, would seem to be that they permanently raised the level of the GDP, thus bringing in slightly higher revenues far into the future. According to the graph and second table, the GDP reached a high 10-year growth rate of 36.79% from 1983 to 1993. However, it reached a similar high of 36.21% from 1991 to 2001 and a higher high of 40.15% from 1947 to 1957 and 51.11% from 1959 to 1969. In fact, the above graph shows that the 10-year growth rate in the GDP has been relatively stable since 1975 to 1985. Hence, these figures don't provide any strong evidence that the Reagan tax cuts permanently affected the GDP one way or the other.
The Office of Tax Analysis of the U.S. Treasury Department has put out a paper titled Revenue Effects of Major Tax Bills. The following estimate of the revenue effects of all major tax bills enacted under Reagan is taken from Table 2 of that document:
      REVENUE EFFECTS OF MAJOR TAX BILLS ENACTED UNDER REAGAN (as percentage of GDP)

                                                        Number of
                                                    years after enactment     First
                                                  --------------------------   2-yr   4-yr
Tax bill                                            1      2      3      4      avg    avg
------------------------------------------------  ----------------------------------------
Economic Recovery Tax Act of 1981...............  -1.21  -2.60  -3.58  -4.15  -1.91  -2.89
Tax Equity and Fiscal Responsibility Act of 1982   0.53   1.07   1.08   1.23   0.80   0.98
Highway Revenue Act of 1982.....................   0.05   0.11   0.10   0.09   0.08   0.09
Social Security Amendments of 1983..............   0.17   0.22   0.22   0.24   0.20   0.21
Interest and Dividend Tax Compliance Act of 1983  -0.07  -0.06  -0.05  -0.04  -0.07  -0.05
Deficit Reduction Act of 1984...................   0.24   0.37   0.47   0.49   0.30   0.39
Omnibus Budget Reconciliation Act of 1985.......   0.02   0.06   0.06   0.06   0.04   0.05
Tax Reform Act of 1986..........................   0.41   0.02  -0.23  -0.16   0.22   0.01
Omnibus Budget Reconciliation Act of 1987.......   0.19   0.28   0.30   0.27   0.24   0.26
------------------------------------------------------------------------------------------
TOTAL...........................................   0.33  -0.53  -1.63  -1.97  -0.10  -0.95

Source: OTA Working Paper 81, Table 2, Office of Tax Analysis, U.S. Treasury Department,
        online at http://www.ustreas.gov/offices/tax-policy/library/ota81.pdf
The above table shows that Reagan's initial tax cut in 1981 was estimated to have a large negative effect on revenues. This is apparent in the graph titled "Receipts and Selected Tax Rates" at recsrc09.html which shows a sharp drop in individual income tax revenues from 1982 to 1984. This drop was arguably a major motivation for the Tax Equity and Fiscal Responsibility Act of 1982 and the Deficit Reduction Act of 1984, both of which had a positive effect on revenues and helped to stabilize them. The Tax Reform Act of 1986 (which cut the top marginal rate from 50 to 28 percent), however, appeared to have only a slight effect on revenues. How could this be? The answer lies in looking more closely at the provisions in the two tax bills. Following are the provisions listed by the Treasury document for the 1981 tax bill:
Economic Recovery Tax Act of 1981
As can be seen, all of the provisions are effectively tax cuts. On the other hand, following are the provisions listed by the document for the 1986 tax bill:
Tax Reform Act of 1986
As can be seen, a number of these provisions are effectively tax hikes, offsetting the additional cuts in the tax rates. Those provisions include items 2, 7 through 10, 12, 13, and the second half of item 1 (repeal of the capital gains exclusion). That is likely the major reason why revenues did not fall further. In any case, this shows that the top marginal rate does not always tell the whole story about the level of individual income taxes.
The red line in the following graph shows the change in real income tax revenues after the Kennedy tax cut was enacted in 1964:
The actual numbers and sources can be found at recsrc09.html. As can be seen, real income tax revenues did go up sharply (54.6%) from 1965 to 1969. However, nearly half of that increase (25.5% of the 54.6%) occurred in 1969 after the Revenue and Expenditure Control Act of 1968 created a temporary 10% income tax surcharge through 6/30/69 (see here). Furthermore, real income tax revenues then stagnated for the next 8 years, not surpassing their 1969 level until 1977. Hence, the data seems inconclusive regarding the effect of the 1964 tax cut on revenues.
Still, it's important to note that the Kennedy tax cut reduced the top marginal rate from 91% to 70%. Reagan went on to reduce it from 70% to 50% in 1981 and from 50% to 28% in 1986. A marginal rate of 91% seems exceptionally high, at least by today's standards. Hence, it would seem possible that Kennedy's tax cut was beneficial, at least in reducing this oppressive top marginal rate but that Reagan's tax cuts took the marginal rates to a level where the negative effects far outweighed any positive effects.
There have been three major tax cuts under Bush. Briefly, the 2001 tax cut created a new 10% individual tax rate and phased in the lowering of individual tax rates. It also phased in an increase in the child tax credit, marriage penalty relief provisions, an increase of the estate tax exemption, an increase in the IRA contribution limit, and the repeal of limits on itemized deductions and personal exemptions. The 2002 tax cut was chiefly aimed at business, creating 30% expensing for certain capital asset purchases, extending the exception under Subpart F for active financing income, and increasing the carryback of net operating losses to 5 years. Finally, the 2003 tax cut lowered the top individual income tax rate on dividends and capital gains and accelerated most of the phased-in provisions of the 2001 tax cut. For a more complete description of the tax cuts, see page 14 of Revenue Effects of Major Tax Bills.
As mentioned above, the real growth in individual income tax receipts is projected to be 10.11% from 1999 to 2009 and 9.18% from 2000 to 2010. These will be the lowest growth rates of any of the 61 10-year spans from 1940 to 2010. However, these rates are projections. Hence, it may be better to look at a shorter time-span to try to judge the effects of the Bush tax cuts. A good choice might be six years as this would cover the span from the year of Clinton's last budget (2001) to the year that just ended (2007). The growth of receipts by source, outlays, and GDP over every 6-year period since 1940 is shown in the following graph:
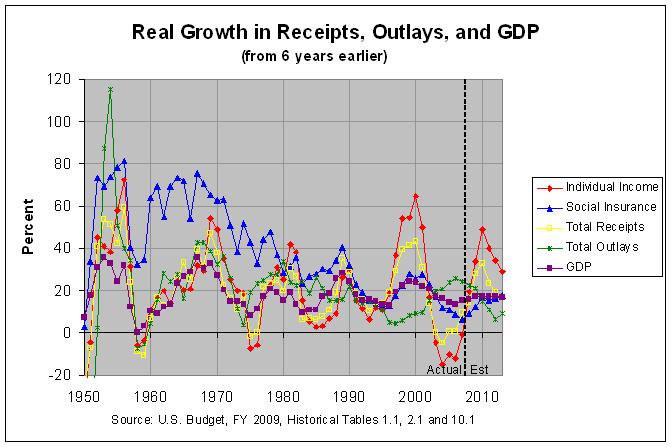
The actual numbers and sources can be found at recgro6y.html. As can be seen in the second table and graph, individual income tax receipts actually declined slightly from 2001 to 2007. Even total receipts were up just 9.4% over that period. Finally, GDP growth has been no faster than usual since 2001. Hence, although it's been just about six years since the 2001 tax cut and four years since the 2003 tax cut, the evidence to this point is that the Bush tax cuts decreased revenues over what they would have been, at least over the short term.