CBO’s Baseline Budget Projections
Total, Total
Actual 2011- 2011-
Year 2009 2010 2011 2012 2013 2014 2015 2016 2017 2018 2019 2020 2015 2020
----------------------- ------ ------ ------ ------ ------ ------ ------ ------ ------ ------ ------ ------ ------ ------
(in billions of dollars)
Total Receipts 2,105 2,143 2,648 2,953 3,236 3,561 3,743 3,975 4,201 4,421 4,640 4,856 16,140 38,234
Total Outlays 3,518 3,485 3,714 3,618 3,760 4,000 4,250 4,560 4,780 4,983 5,274 5,541 19,342 44,480
----------------------- ------ ------ ------ ------ ------ ------ ------ ------ ------ ------ ------ ------ ------ ------
Deficit(-) -1,413 -1,342 -1,066 -665 -525 -438 -507 -585 -579 -562 -634 -685 -3,202 -6,246
Debt Held by the Public 7,545 9,031 10,007 10,790 11,422 11,950 12,544 13,214 13,885 14,546 15,281 16,073 n.a. n.a.
Gross Federal Debt 11,876 13,538 14,642 15,591 16,421 17,183 18,051 19,007 19,978 20,956 22,018 23,132 n.a. n.a.
Gross Domestic Product 14,230 14,666 15,148 15,764 16,705 17,760 18,630 19,508 20,398 21,293 22,205 23,154 84,008 190,567
---------------------------------------------------------------------------------------------------------------------------------------
(as a percentage of GDP)
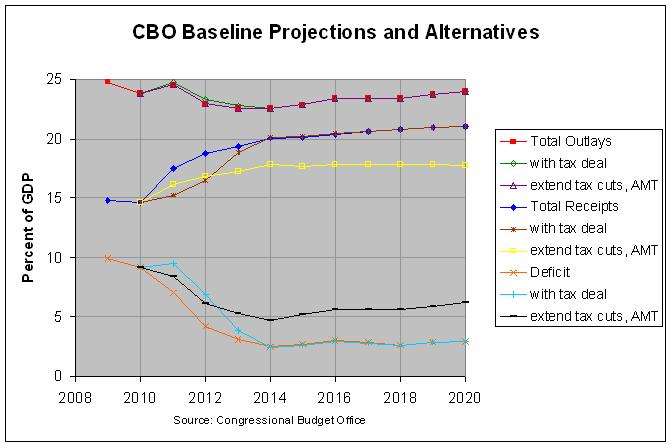
Total Receipts 14.8 14.6 17.5 18.7 19.4 20.1 20.1 20.4 20.6 20.8 20.9 21.0 19.2 20.1
Total Outlays 24.7 23.8 24.5 23.0 22.5 22.5 22.8 23.4 23.4 23.4 23.8 23.9 23.0 23.3
----------------------- ------ ------ ------ ------ ------ ------ ------ ------ ------ ------ ------ ------ ------ ------
Deficit(-) -9.9 -9.1 -7.0 -4.2 -3.1 -2.5 -2.7 -3.0 -2.8 -2.6 -2.9 -3.0 -3.8 -3.3
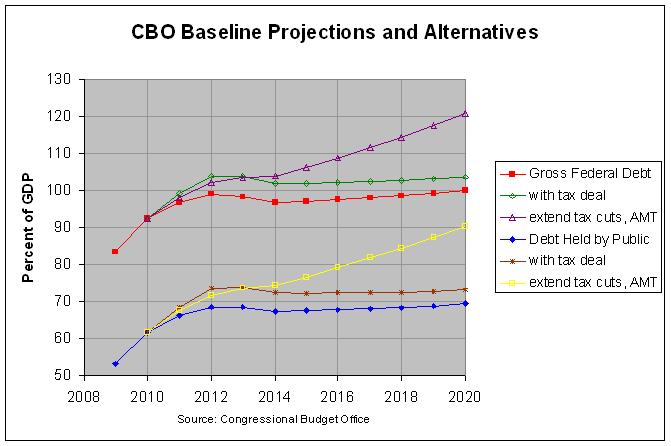
Debt Held by the Public 53.0 61.6 66.1 68.5 68.4 67.3 67.3 67.7 68.1 68.3 68.8 69.4 n.a. n.a.
Gross Federal Debt 83.5 92.3 96.7 98.9 98.3 96.8 96.9 97.4 97.9 98.4 99.2 99.9 n.a. n.a.
=======================================================================================================================================
Budgetary Effects of Selected Policy Alternatives Not Included in CBO’s Baseline
Total, Total
Actual 2011- 2011-
Year 2009 2010 2011 2012 2013 2014 2015 2016 2017 2018 2019 2020 2015 2020
----------------------- ------ ------ ------ ------ ------ ------ ------ ------ ------ ------ ------ ------ ------ ------
(in billions of dollars)
Extend EGTRRA, JGTRRA,
and AMT fix 0 0 -200 -302 -357 -402 -453 -506 -563 -621 -684 -753 -1,714 -4,840
Cost of Tax Deal (S.A. 4753)
Changes in Receipts 0 0 -337 -362 -81 7 17 13 10 6 3 2 -756 -721
Changes in Outlays 0 0 37 61 39 0 0 0 0 0 0 0 136 136
Total Effect on Deficit 0 0 -374 -423 -120 7 17 13 10 6 3 2 -893 -858
----------------------- ------ ------ ------ ------ ------ ------ ------ ------ ------ ------ ------ ------ ------ ------
(in billions of dollars, cumulative)
Extend EGTRRA, JGTRRA,
and AMT fix 0 0 -200 -502 -859 -1,261 -1,714 -2,220 -2,783 -3,403 -4,087 -4,840 -1,714 -4,840
Cost of Tax Deal (S.A. 4753)
Changes in Receipts 0 0 -337 -699 -780 -774 -756 -743 -733 -727 -723 -721 -756 -721
Changes in Outlays 0 0 37 98 136 136 136 136 136 136 136 136 136 136
----------------------- ------ ------ ------ ------ ------ ------ ------ ------ ------ ------ ------ ------ ------ ------
Total Effect on Deficit 0 0 -374 -797 -917 -910 -893 -879 -869 -863 -860 -858 -893 -858
---------------------------------------------------------------------------------------------------------------------------------------
(as a percentage of GDP)
Extend EGTRRA, JGTRRA,
and AMT fix 0.0 0.0 -1.3 -1.9 -2.1 -2.3 -2.4 -2.6 -2.8 -2.9 -3.1 -3.3 -2.0 -2.5
Cost of Tax Deal (S.A. 4753)
Changes in Receipts 0.0 0.0 -2.2 -2.3 -0.5 0.0 0.1 0.1 0.0 0.0 0.0 0.0 -0.9 -0.4
Changes in Outlays 0.0 0.0 0.2 0.4 0.2 0.0 0.0 0.0 0.0 0.0 0.0 0.0 0.2 0.1
----------------------- ------ ------ ------ ------ ------ ------ ------ ------ ------ ------ ------ ------ ------ ------
Total Effect on Deficit 0.0 0.0 -2.5 -2.7 -0.7 0.0 0.1 0.1 0.0 0.0 0.0 0.0 -1.1 -0.5
---------------------------------------------------------------------------------------------------------------------------------------
(as a percentage of GDP, cumulative)
Extend EGTRRA, JGTRRA,
and AMT fix 0.0 0.0 -1.3 -3.2 -5.1 -7.1 -9.2 -11.4 -13.6 -16.0 -18.4 -20.9 -9.2 -20.9
Cost of Tax Deal (S.A. 4753)
Changes in Receipts 0.0 0.0 -2.2 -4.4 -4.7 -4.4 -4.1 -3.8 -3.6 -3.4 -3.3 -3.1 -4.1 -3.1
Changes in Outlays 0.0 0.0 0.2 0.6 0.8 0.8 0.7 0.7 0.7 0.6 0.6 0.6 0.7 0.6
----------------------- ------ ------ ------ ------ ------ ------ ------ ------ ------ ------ ------ ------ ------ ------
Total Effect on Deficit 0.0 0.0 -2.5 -5.1 -5.5 -5.1 -4.8 -4.5 -4.3 -4.1 -3.9 -3.7 -4.8 -3.7
=======================================================================================================================================
CBO’s Baseline Budget Projections plus Tax Deal (S.A. 4753)
Total, Total
Actual 2011- 2011-
Year 2009 2010 2011 2012 2013 2014 2015 2016 2017 2018 2019 2020 2015 2020
----------------------- ------ ------ ------ ------ ------ ------ ------ ------ ------ ------ ------ ------ ------ ------
(in billions of dollars)
Total Receipts 2,105 2,143 2,310 2,591 3,155 3,568 3,760 3,989 4,211 4,427 4,644 4,858 15,384 37,513
Total Outlays 3,518 3,485 3,750 3,679 3,799 4,000 4,250 4,560 4,780 4,983 5,274 5,541 19,479 44,617
----------------------- ------ ------ ------ ------ ------ ------ ------ ------ ------ ------ ------ ------ ------ ------
Deficit(-) -1,413 -1,342 -1,440 -1,088 -644 -432 -490 -571 -569 -556 -631 -683 -4,095 -7,104
Debt Held by the Public 7,545 9,031 10,381 11,587 12,339 12,861 13,437 14,093 14,754 15,409 16,141 16,931 n.a. n.a.
Gross Federal Debt 11,876 13,538 15,016 16,388 17,338 18,093 18,944 19,886 20,847 21,819 22,878 23,990 n.a. n.a.
Gross Domestic Product 14,230 14,666 15,148 15,764 16,705 17,760 18,630 19,508 20,398 21,293 22,205 23,154 84,008 190,567
---------------------------------------------------------------------------------------------------------------------------------------
(as a percentage of GDP)
Total Receipts 14.8 14.6 15.3 16.4 18.9 20.1 20.2 20.4 20.6 20.8 20.9 21.0 18.3 19.7
Total Outlays 24.7 23.8 24.8 23.3 22.7 22.5 22.8 23.4 23.4 23.4 23.8 23.9 23.2 23.4
----------------------- ------ ------ ------ ------ ------ ------ ------ ------ ------ ------ ------ ------ ------ ------
Deficit(-) -9.9 -9.1 -9.5 -6.9 -3.9 -2.4 -2.6 -2.9 -2.8 -2.6 -2.8 -3.0 -4.9 -3.7
Debt Held by the Public 53.0 61.6 68.5 73.5 73.9 72.4 72.1 72.2 72.3 72.4 72.7 73.1 n.a. n.a.
Gross Federal Debt 83.5 92.3 99.1 104.0 103.8 101.9 101.7 101.9 102.2 102.5 103.0 103.6 n.a. n.a.
=======================================================================================================================================
CBO’s Baseline Budget Projections plus extend EGTRRA, JGTRRA, and AMT fix
Total, Total
Actual 2011- 2011-
Year 2009 2010 2011 2012 2013 2014 2015 2016 2017 2018 2019 2020 2015 2020
----------------------- ------ ------ ------ ------ ------ ------ ------ ------ ------ ------ ------ ------ ------ ------
(in billions of dollars)
Total Receipts 2,105 2,143 2,448 2,651 2,878 3,160 3,290 3,469 3,638 3,800 3,957 4,103 14,426 33,394
Total Outlays 3,518 3,485 3,714 3,618 3,760 4,000 4,250 4,560 4,780 4,983 5,274 5,541 19,342 44,480
Deficit(-) -1,413 -1,342 -1,266 -967 -882 -840 -961 -1,091 -1,141 -1,183 -1,318 -1,438 -4,916 -11,086
Debt Held by the Public 7,545 9,031 10,207 11,292 12,280 13,211 14,258 15,434 16,668 17,949 19,368 20,913 n.a. n.a.
Gross Federal Debt 11,876 13,538 14,842 16,092 17,280 18,444 19,765 21,227 22,760 24,360 26,105 27,972 n.a. n.a.
Gross Domestic Product 14,230 14,666 15,148 15,764 16,705 17,760 18,630 19,508 20,398 21,293 22,205 23,154 84,008 190,567
---------------------------------------------------------------------------------------------------------------------------------------
(as a percentage of GDP)
Total Receipts 14.8 14.6 16.2 16.8 17.2 17.8 17.7 17.8 17.8 17.8 17.8 17.7 17.2 17.5
Total Outlays 24.7 23.8 24.5 23.0 22.5 22.5 22.8 23.4 23.4 23.4 23.8 23.9 23.0 23.3
Deficit(-) -9.9 -9.1 -8.4 -6.1 -5.3 -4.7 -5.2 -5.6 -5.6 -5.6 -5.9 -6.2 -5.9 -5.8
Debt Held by the Public 53.0 61.6 67.4 71.6 73.5 74.4 76.5 79.1 81.7 84.3 87.2 90.3 n.a. n.a.
Gross Federal Debt 83.5 92.3 98.0 102.1 103.4 103.9 106.1 108.8 111.6 114.4 117.6 120.8 n.a. n.a.
Source: CBO Estimate of Changes in Revenues and Direct Spending for S.A. 4753,
CBO Budget Projections, August 2010
Go to Budget Home Page
