IMPORTS OF GOODS, BALANCE OF PAYMENTS BASIS, EXCLUDING MILITARY
(billions of dollars)
Capital Automobile Imports,
Food, Industrial goods, vehicles, Other n.e.c., & Petroleum
Total feeds, & supplies & except parts, & Consumer U.S. goods and
Year Imports beverages materials automotive engines Goods returned products* GDP
---- ---------- ---------- ---------- ---------- ---------- ---------- ---------- ---------- ----------
1978 176.0 15.8 83.2 19.3 25.0 29.4 3.3 42.6 2294.7
1979 212.0 18.0 108.0 24.6 26.6 31.3 3.5 60.4 2563.3
1980 249.8 18.6 132.5 31.6 28.3 34.3 4.6 79.5 2789.5
1981 265.1 18.6 134.5 37.1 31.0 38.4 5.5 78.4 3128.4
1982 247.6 17.5 110.6 38.4 34.3 39.7 7.2 62.0 3255.0
1983 268.9 18.8 108.8 43.7 43.0 47.3 7.2 55.1 3536.7
1984 332.4 21.9 124.1 60.4 56.5 61.1 8.4 58.1 3933.2
1985 338.1 21.9 114.0 61.3 64.9 66.3 9.7 51.4 4220.3
1986 368.4 24.4 104.2 72.0 78.1 79.4 10.4 34.3 4462.8
1987 409.8 24.8 113.7 85.1 85.2 88.8 12.1 42.9 4739.5
1988 447.2 24.9 122.7 102.2 87.9 96.4 13.0 39.6 5103.8
1989 477.7 24.9 135.5 112.3 87.4 103.6 14.0 50.9 5484.4
1990 498.4 26.4 145.3 116.4 88.2 105.0 17.2 62.3 5803.1
1991 491.0 26.2 133.0 121.1 85.5 107.7 17.5 51.7 5995.9
1992 536.5 27.6 140.7 134.8 91.5 122.4 19.6 51.6 6337.7
1993 589.4 27.9 152.2 153.2 102.1 133.7 20.4 51.5 6657.4
1994 668.7 31.0 164.9 185.0 118.1 145.9 23.8 51.3 7072.2
1995 749.4 33.2 184.5 222.1 123.7 159.7 26.1 56.0 7397.7
1996 803.1 35.7 208.9 228.4 128.7 172.5 28.8 72.7 7816.9
1997 876.8 39.7 216.7 253.6 139.4 195.2 32.2 71.8 8304.3
1998 918.6 41.3 202.5 269.8 148.6 218.5 38.0 50.9 8747.0
1999 1031.8 43.6 224.1 295.7 179.0 243.5 45.8 67.8 9268.4
2000 1226.7 46.0 302.2 347.0 195.9 284.1 51.5 120.3 9817.0
2001 1148.2 46.6 276.1 298.0 189.8 286.6 51.2 103.6 10128.0
2002 1167.4 49.7 268.1 283.3 203.7 310.7 51.8 103.5 10469.6
2003 1264.3 55.8 314.5 295.9 210.1 337.7 50.3 133.1 10960.8
2004 1477.1 62.1 412.9 343.6 228.2 377.1 53.1 180.5 11685.9
2005 1681.8 68.1 524.5 379.3 239.5 411.5 58.8 251.9 12433.9
2006 1861.4 74.9 602.5 418.3 256.7 446.1 62.9 302.4 13194.7
EXPORTS OF GOODS, BALANCE OF PAYMENTS BASIS, EXCLUDING MILITARY
(billions of dollars)
Capital Automobile
Food, Industrial goods, vehicles, Other Petroleum
Total feeds, & supplies & except parts, & Consumer Exports, and
Year Exports beverages materials automotive engines Goods n.e.c. products* GDP
---- ---------- ---------- ---------- ---------- ---------- ---------- ---------- ---------- ----------
1978 142.1 25.7 39.6 47.5 15.2 11.4 2.8 1.9 2294.7
1979 184.4 30.5 58.5 60.2 17.9 14.0 3.4 2.4 2563.3
1980 224.3 36.3 72.1 76.3 17.4 17.8 4.4 3.6 2789.5
1981 237.0 38.8 70.2 84.2 19.7 17.7 6.5 4.6 3128.4
1982 211.2 32.2 64.1 76.5 17.2 16.1 5.1 6.9 3255.0
1983 201.8 32.1 58.9 71.7 18.5 14.9 5.7 5.6 3536.7
1984 219.9 32.2 64.1 77.0 22.4 15.1 9.1 5.4 3933.2
1985 215.9 24.6 61.2 79.3 24.9 14.6 11.3 5.7 4220.3
1986 223.3 23.5 64.7 82.8 25.1 16.7 10.5 4.4 4462.8
1987 250.2 25.2 70.1 92.7 27.6 20.3 14.3 4.6 4739.5
1988 320.2 33.8 90.0 119.1 33.4 27.0 17.0 4.5 5103.8
1989 359.9 36.3 98.5 136.9 35.1 35.9 17.2 6.5 5484.4
1990 387.4 35.1 105.7 153.0 36.2 43.5 13.9 8.4 5803.1
1991 414.1 35.7 109.8 166.6 39.9 46.6 15.5 8.4 5995.9
1992 439.6 40.3 109.7 176.4 46.9 51.2 15.2 7.6 6337.7
1993 456.9 40.5 112.0 182.7 51.6 54.5 15.7 7.5 6657.4
1994 502.9 42.4 121.2 205.7 57.5 59.7 16.3 7.0 7072.2
1995 575.2 50.8 146.1 234.4 61.4 64.2 18.3 8.1 7397.7
1996 612.1 56.0 148.3 254.0 64.4 69.3 20.3 9.6 7816.9
1997 678.4 52.0 158.7 295.8 73.4 77.0 21.4 10.4 8304.3
1998 670.4 46.8 148.7 299.8 72.5 79.4 23.1 8.1 8747.0
1999 684.0 46.0 147.6 311.2 75.3 80.9 22.9 8.6 9268.4
2000 772.0 47.9 172.7 357.0 80.4 89.4 24.7 12.0 9817.0
2001 718.7 49.4 160.2 321.7 75.4 88.3 23.6 10.6 10128.0
2002 682.4 49.6 156.8 290.4 78.9 84.4 22.2 10.3 10469.6
2003 713.4 55.0 173.1 293.7 80.6 89.9 21.1 12.7 10960.8
2004 807.5 56.6 203.9 331.4 89.2 103.2 23.1 17.1 11685.9
2005 894.6 59.0 233.1 362.3 98.6 116.1 25.6 22.7 12433.9
2006 1023.1 66.0 276.1 413.9 107.2 130.0 30.0 31.6 13194.7
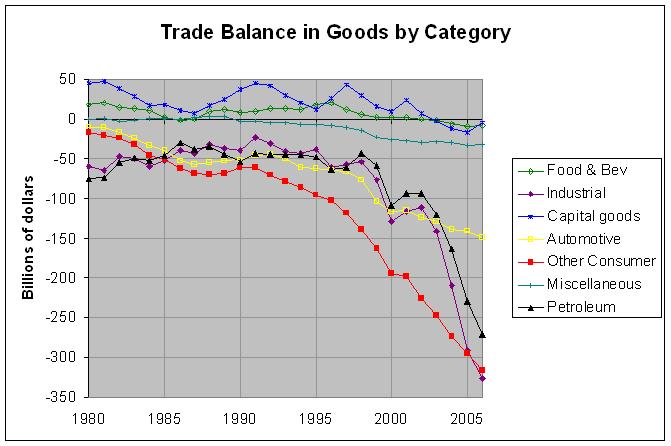
BALANCES OF GOODS, BALANCE OF PAYMENTS BASIS, EXCLUDING MILITARY
(billions of dollars)
Capital Automobile
Food, Industrial goods, vehicles, Other Petroleum
Total feeds, & supplies & except parts, & Consumer Balances, and
Year Balances beverages materials automotive engines Goods n.e.c. products* GDP
---- ---------- ---------- ---------- ---------- ---------- ---------- ---------- ---------- ----------
1978 -33.9 9.9 -43.6 28.2 -9.9 -18.0 -0.5 -40.6 2294.7
1979 -27.6 12.5 -49.5 35.6 -8.7 -17.3 -0.1 -58.0 2563.3
1980 -25.5 17.7 -60.4 44.7 -10.8 -16.5 -0.2 -75.9 2789.5
1981 -28.0 20.3 -64.3 47.0 -11.3 -20.7 0.9 -73.8 3128.4
1982 -36.5 14.7 -46.5 38.1 -17.1 -23.5 -2.1 -55.1 3255.0
1983 -67.1 13.3 -49.9 27.9 -24.6 -32.4 -1.5 -49.5 3536.7
1984 -112.5 10.3 -60.0 16.6 -34.1 -46.0 0.6 -52.6 3933.2
1985 -122.2 2.7 -52.8 18.0 -40.0 -51.7 1.6 -45.7 4220.3
1986 -145.1 -0.9 -39.5 10.8 -53.0 -62.6 0.0 -29.8 4462.8
1987 -159.6 0.4 -43.7 7.6 -57.6 -68.5 2.2 -38.3 4739.5
1988 -127.0 8.8 -32.7 16.9 -54.6 -69.4 4.0 -35.2 5103.8
1989 -117.7 11.4 -37.0 24.7 -52.3 -67.8 3.2 -44.5 5484.4
1990 -111.0 8.7 -39.6 36.6 -52.0 -61.5 -3.2 -53.9 5803.1
1991 -76.9 9.5 -23.2 45.4 -45.6 -61.1 -2.0 -43.3 5995.9
1992 -96.9 12.7 -31.0 41.6 -44.6 -71.2 -4.4 -44.0 6337.7
1993 -132.5 12.7 -40.2 29.6 -50.5 -79.2 -4.7 -44.0 6657.4
1994 -165.8 11.4 -43.7 20.7 -60.6 -86.2 -7.4 -44.3 7072.2
1995 -174.2 17.6 -38.4 12.3 -62.3 -95.6 -7.8 -47.9 7397.7
1996 -191.0 20.2 -60.6 25.5 -64.4 -103.2 -8.5 -63.1 7816.9
1997 -198.4 12.2 -58.0 42.3 -66.0 -118.2 -10.8 -61.4 8304.3
1998 -248.2 5.6 -53.7 30.0 -76.1 -139.1 -14.8 -42.8 8747.0
1999 -347.8 2.4 -76.5 15.5 -103.7 -162.6 -22.9 -59.2 9268.4
2000 -454.7 1.9 -129.5 10.0 -115.5 -194.8 -26.7 -108.3 9817.0
2001 -429.5 2.8 -115.9 23.7 -114.3 -198.2 -27.5 -93.0 10128.0
2002 -485.0 -0.1 -111.3 7.1 -124.8 -226.4 -29.6 -93.2 10469.6
2003 -550.9 -0.8 -141.4 -2.2 -129.5 -247.8 -29.2 -120.4 10960.8
2004 -669.6 -5.6 -209.0 -12.1 -138.9 -273.9 -30.0 -163.4 11685.9
2005 -787.1 -9.1 -291.5 -17.0 -140.9 -295.4 -33.2 -229.2 12433.9
2006 -838.3 -9.0 -326.5 -4.4 -149.5 -316.1 -32.8 -270.9 13194.7
-------------------------------------------------------------------------------------------------------
IMPORTS OF GOODS, BALANCE OF PAYMENTS BASIS, EXCLUDING MILITARY
(percent of GDP)
Capital Automobile Imports,
Food, Industrial goods, vehicles, Other n.e.c., & Petroleum
Total feeds, & supplies & except parts, & Consumer U.S. goods and GDP
Year Imports beverages materials automotive engines Goods returned products* ($bil)
---- ---------- ---------- ---------- ---------- ---------- ---------- ---------- ---------- ----------
1978 7.670 0.690 3.627 0.841 1.091 1.280 0.142 1.854 2294.7
1979 8.271 0.703 4.212 0.960 1.039 1.220 0.137 2.358 2563.3
1980 8.953 0.665 4.749 1.132 1.013 1.228 0.165 2.850 2789.5
1981 8.473 0.593 4.300 1.187 0.991 1.227 0.176 2.505 3128.4
1982 7.608 0.537 3.398 1.181 1.054 1.219 0.220 1.903 3255.0
1983 7.603 0.532 3.076 1.237 1.217 1.337 0.204 1.558 3536.7
1984 8.452 0.556 3.155 1.535 1.437 1.553 0.215 1.476 3933.2
1985 8.011 0.518 2.701 1.452 1.538 1.572 0.230 1.218 4220.3
1986 8.255 0.546 2.335 1.613 1.749 1.778 0.234 0.768 4462.8
1987 8.646 0.523 2.400 1.796 1.797 1.874 0.255 0.906 4739.5
1988 8.762 0.488 2.404 2.002 1.723 1.889 0.255 0.777 5103.8
1989 8.710 0.454 2.471 2.047 1.594 1.890 0.255 0.928 5484.4
1990 8.589 0.455 2.504 2.006 1.520 1.809 0.296 1.073 5803.1
1991 8.189 0.437 2.219 2.020 1.425 1.795 0.292 0.863 5995.9
1992 8.466 0.436 2.220 2.127 1.443 1.932 0.309 0.814 6337.7
1993 8.853 0.418 2.287 2.300 1.533 2.008 0.306 0.773 6657.4
1994 9.455 0.438 2.332 2.616 1.670 2.063 0.336 0.725 7072.2
1995 10.130 0.449 2.494 3.003 1.672 2.159 0.352 0.757 7397.7
1996 10.274 0.457 2.672 2.922 1.647 2.207 0.368 0.931 7816.9
1997 10.558 0.478 2.609 3.054 1.679 2.351 0.387 0.864 8304.3
1998 10.502 0.472 2.315 3.085 1.699 2.498 0.434 0.582 8747.0
1999 11.132 0.470 2.418 3.191 1.931 2.628 0.495 0.732 9268.4
2000 12.496 0.468 3.078 3.535 1.995 2.894 0.524 1.225 9817.0
2001 11.337 0.461 2.726 2.942 1.874 2.829 0.505 1.023 10128.0
2002 11.150 0.475 2.561 2.706 1.946 2.968 0.495 0.988 10469.6
2003 11.535 0.509 2.869 2.699 1.917 3.081 0.459 1.214 10960.8
2004 12.640 0.532 3.534 2.940 1.952 3.227 0.455 1.544 11685.9
2005 13.526 0.548 4.219 3.051 1.926 3.309 0.473 2.026 12433.9
2006 14.107 0.568 4.567 3.170 1.945 3.381 0.476 2.292 13194.7
EXPORTS OF GOODS, BALANCE OF PAYMENTS BASIS, EXCLUDING MILITARY
(percent of GDP)
Capital Automobile
Food, Industrial goods, vehicles, Other Petroleum
Total feeds, & supplies & except parts, & Consumer Exports, and GDP
Year Exports beverages materials automotive engines Goods n.e.c. products* ($bil)
---- ---------- ---------- ---------- ---------- ---------- ---------- ---------- ---------- ----------
1978 6.191 1.119 1.725 2.070 0.661 0.496 0.120 0.085 2294.7
1979 7.195 1.190 2.282 2.348 0.698 0.545 0.132 0.095 2563.3
1980 8.039 1.301 2.584 2.735 0.625 0.636 0.158 0.128 2789.5
1981 7.577 1.242 2.244 2.691 0.629 0.566 0.206 0.146 3128.4
1982 6.487 0.989 1.968 2.350 0.529 0.495 0.155 0.211 3255.0
1983 5.706 0.907 1.666 2.026 0.522 0.422 0.162 0.158 3536.7
1984 5.592 0.819 1.630 1.958 0.570 0.384 0.231 0.138 3933.2
1985 5.116 0.582 1.449 1.880 0.591 0.346 0.268 0.135 4220.3
1986 5.005 0.527 1.450 1.856 0.562 0.375 0.234 0.099 4462.8
1987 5.279 0.532 1.478 1.956 0.582 0.428 0.302 0.098 4739.5
1988 6.274 0.662 1.764 2.334 0.654 0.529 0.332 0.088 5103.8
1989 6.563 0.662 1.795 2.497 0.641 0.654 0.314 0.118 5484.4
1990 6.676 0.605 1.821 2.636 0.624 0.750 0.240 0.144 5803.1
1991 6.906 0.596 1.831 2.778 0.665 0.777 0.259 0.140 5995.9
1992 6.937 0.635 1.731 2.783 0.740 0.808 0.239 0.120 6337.7
1993 6.864 0.609 1.682 2.744 0.774 0.818 0.236 0.113 6657.4
1994 7.110 0.599 1.714 2.909 0.813 0.844 0.231 0.099 7072.2
1995 7.775 0.687 1.975 3.169 0.830 0.867 0.248 0.109 7397.7
1996 7.831 0.716 1.897 3.249 0.823 0.887 0.259 0.123 7816.9
1997 8.169 0.626 1.911 3.562 0.884 0.928 0.258 0.125 8304.3
1998 7.665 0.535 1.700 3.428 0.829 0.907 0.265 0.092 8747.0
1999 7.380 0.496 1.593 3.358 0.812 0.873 0.247 0.093 9268.4
2000 7.864 0.488 1.759 3.637 0.819 0.910 0.252 0.122 9817.0
2001 7.096 0.488 1.582 3.177 0.745 0.872 0.233 0.105 10128.0
2002 6.518 0.474 1.498 2.774 0.754 0.806 0.212 0.099 10469.6
2003 6.509 0.502 1.579 2.679 0.736 0.820 0.193 0.116 10960.8
2004 6.910 0.484 1.745 2.836 0.763 0.883 0.198 0.146 11685.9
2005 7.195 0.474 1.874 2.914 0.793 0.934 0.206 0.182 12433.9
2006 7.754 0.500 2.092 3.137 0.812 0.985 0.228 0.239 13194.7
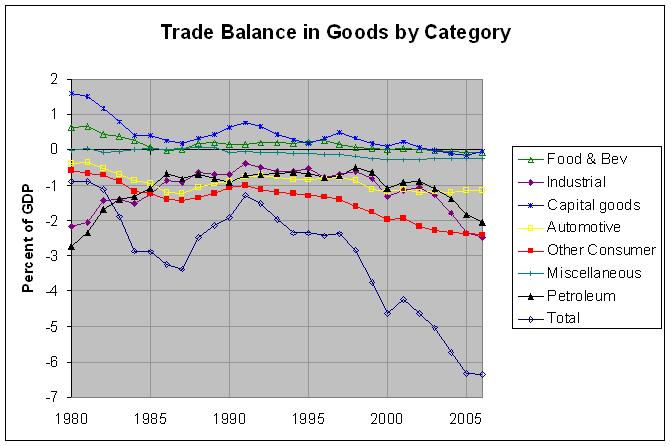
BALANCES OF GOODS, BALANCE OF PAYMENTS BASIS, EXCLUDING MILITARY
(percent of GDP)
Capital Automobile
Food, Industrial goods, vehicles, Other Petroleum
Total feeds, & supplies & except parts, & Consumer Balances, and GDP
Year Balances beverages materials automotive engines Goods n.e.c. products* ($bil)
---- ---------- ---------- ---------- ---------- ---------- ---------- ---------- ---------- ----------
1978 -1.478 0.429 -1.902 1.229 -0.430 -0.784 -0.021 -1.770 2294.7
1979 -1.075 0.487 -1.930 1.388 -0.341 -0.674 -0.005 -2.262 2563.3
1980 -0.914 0.635 -2.165 1.603 -0.388 -0.592 -0.007 -2.722 2789.5
1981 -0.896 0.648 -2.056 1.504 -0.361 -0.661 0.030 -2.360 3128.4
1982 -1.121 0.452 -1.430 1.169 -0.524 -0.723 -0.065 -1.692 3255.0
1983 -1.897 0.375 -1.410 0.790 -0.695 -0.915 -0.042 -1.400 3536.7
1984 -2.860 0.262 -1.525 0.423 -0.867 -1.170 0.016 -1.338 3933.2
1985 -2.895 0.064 -1.252 0.427 -0.947 -1.226 0.039 -1.082 4220.3
1986 -3.251 -0.019 -0.885 0.243 -1.187 -1.403 0.001 -0.669 4462.8
1987 -3.367 0.009 -0.922 0.160 -1.215 -1.446 0.047 -0.808 4739.5
1988 -2.488 0.173 -0.640 0.331 -1.069 -1.361 0.078 -0.689 5103.8
1989 -2.147 0.208 -0.675 0.450 -0.953 -1.236 0.059 -0.811 5484.4
1990 -1.913 0.150 -0.683 0.631 -0.896 -1.059 -0.056 -0.929 5803.1
1991 -1.283 0.159 -0.388 0.758 -0.760 -1.019 -0.034 -0.723 5995.9
1992 -1.529 0.200 -0.488 0.656 -0.703 -1.123 -0.069 -0.694 6337.7
1993 -1.990 0.190 -0.605 0.444 -0.759 -1.190 -0.071 -0.661 6657.4
1994 -2.345 0.161 -0.618 0.293 -0.857 -1.219 -0.105 -0.626 7072.2
1995 -2.354 0.238 -0.519 0.166 -0.843 -1.292 -0.105 -0.648 7397.7
1996 -2.443 0.259 -0.776 0.327 -0.824 -1.320 -0.109 -0.807 7816.9
1997 -2.389 0.147 -0.698 0.509 -0.795 -1.423 -0.130 -0.739 8304.3
1998 -2.838 0.064 -0.614 0.343 -0.870 -1.590 -0.170 -0.490 8747.0
1999 -3.753 0.026 -0.825 0.168 -1.119 -1.754 -0.247 -0.639 9268.4
2000 -4.632 0.019 -1.320 0.102 -1.177 -1.984 -0.272 -1.103 9817.0
2001 -4.241 0.027 -1.145 0.234 -1.129 -1.957 -0.272 -0.918 10128.0
2002 -4.632 -0.001 -1.063 0.068 -1.192 -2.162 -0.283 -0.890 10469.6
2003 -5.026 -0.007 -1.290 -0.020 -1.182 -2.261 -0.266 -1.098 10960.8
2004 -5.730 -0.048 -1.789 -0.104 -1.189 -2.344 -0.257 -1.398 11685.9
2005 -6.331 -0.074 -2.344 -0.137 -1.133 -2.376 -0.267 -1.843 12433.9
2006 -6.353 -0.068 -2.474 -0.033 -1.133 -2.396 -0.249 -2.053 13194.7
=======================================================================================================
* Petroleum and products is a sub-category of the Industrial supplies & materials category.
Source: Bureau of Economic Analysis, U.S. International Transactions Accounts Data,
Table 2a and Table 2b
Go to Budget Home Page
