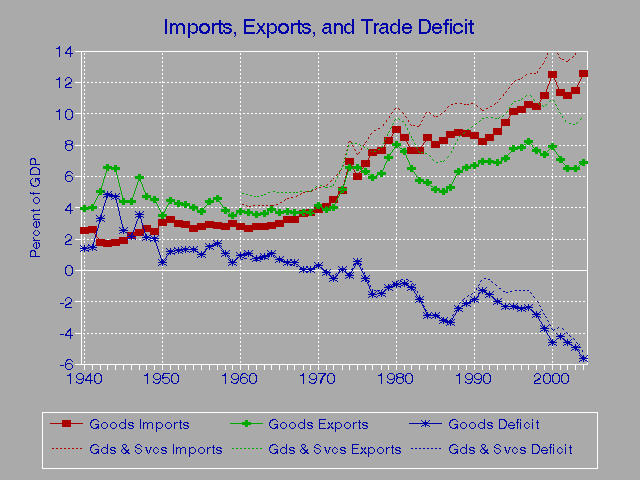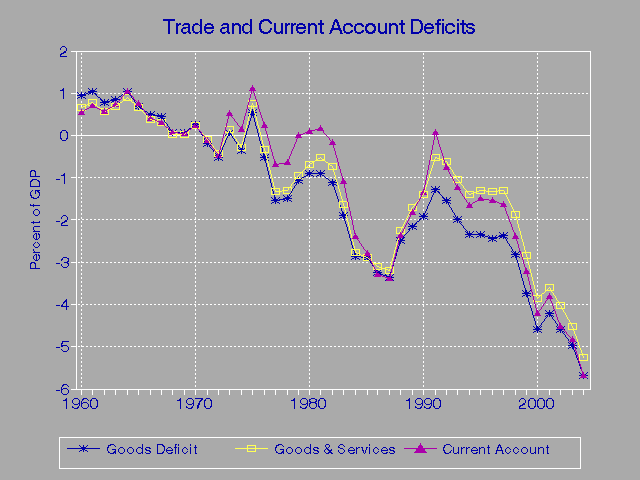

U.S. IMPORTS, EXPORTS, AND TRADE BALANCE: 1940-2004
(billions of dollars)
Merchan- Goods & Goods & Goods & Current Unilatrl
General dise Services Services Services Account Income current
Year Imports Exports Balance Imports Exports Balance Balance Balance xfers GDP
---- ------- ------- ------- ------- ------- ------- ------- ------- ------- -------
1940 2.6 4.0 1.4 101.4
1941 3.3 5.1 1.8 126.7
1942 2.8 8.1 5.3 161.9
1943 3.4 13.0 9.6 198.6
1944 3.9 14.3 10.3 219.8
1945 4.2 9.8 5.6 223.1
1946 4.9 9.7 4.8 222.3
1947 5.8 14.4 8.7 244.2
1948 7.1 12.7 5.5 269.2
1949 6.6 12.1 5.4 267.3
1950 8.9 10.3 1.4 293.8
1951 11.0 15.0 4.1 339.3
1952 10.7 15.2 4.5 358.3
1953 10.9 15.8 4.9 379.4
1954 10.2 15.1 4.9 380.4
1955 11.4 15.5 4.2 414.8
1956 12.6 19.1 6.5 Goods & Goods & Goods & Current Unilatrl 437.5
1957 13.0 20.9 7.9 Services Services Services Account Income current 461.1
1958 12.8 17.9 5.1 Imports Exports Balance Balance Balance xfers 467.2
1959 15.2 17.6 2.4 ------- ------- ------- ------- ------- ------- 506.6
1960 14.8 19.7 4.9 22.4 25.9 3.5 2.8 3.4 -4.1 526.4
1961 14.5 20.1 5.6 22.2 26.4 4.2 3.8 3.8 -4.1 544.7
1962 16.3 20.8 4.5 24.4 27.7 3.4 3.4 4.3 -4.3 585.6
1963 17.0 22.3 5.2 25.4 29.6 4.2 4.4 4.6 -4.4 617.7
1964 18.7 25.5 6.8 27.3 33.3 6.0 6.8 5.0 -4.2 663.6
1965 21.5 26.5 5.0 30.6 35.3 4.7 5.4 5.4 -4.6 719.1
1966 25.5 29.3 3.8 36.0 38.9 2.9 3.0 5.0 -5.0 787.8
1967 26.9 30.7 3.8 38.7 41.3 2.6 2.6 5.3 -5.3 832.6
1968 33.0 33.6 0.6 45.3 45.5 0.3 0.6 6.0 -5.6 910.0
1969 35.8 36.4 0.6 49.1 49.2 0.1 0.4 6.0 -5.7 984.6
1970 39.9 42.5 2.6 54.4 56.6 2.3 2.3 6.2 -6.2 1038.5
1971 45.6 43.3 -2.3 61.0 59.7 -1.3 -1.4 7.3 -7.4 1127.1
1972 55.8 49.4 -6.4 72.7 67.2 -5.4 -5.8 8.2 -8.5 1238.3
1973 70.5 71.4 0.9 89.3 91.2 1.9 7.1 12.2 -6.9 1382.7
1974 103.8 98.3 -5.5 125.2 120.9 -4.3 2.0 15.5 -9.2 1500.0
1975 98.2 107.1 8.9 120.2 132.6 12.4 18.1 12.8 -7.1 1638.3
1976 124.2 114.7 -9.5 148.8 142.7 -6.1 4.3 16.1 -5.7 1825.3
1977 151.9 120.8 -31.1 179.5 152.3 -27.2 -14.3 18.1 -5.2 2030.9
1978 176.0 142.1 -33.9 208.2 178.4 -29.8 -15.1 20.4 -5.8 2294.7
1979 212.0 184.4 -27.6 248.7 224.1 -24.6 -0.3 30.9 -6.6 2563.3
1980 249.8 224.3 -25.5 291.2 271.8 -19.4 2.3 30.1 -8.3 2789.5
1981 265.1 237.0 -28.0 310.6 294.4 -16.2 5.0 32.9 -11.7 3128.4
1982 247.6 211.2 -36.5 299.4 275.2 -24.2 -5.5 35.2 -16.5 3255.0
1983 268.9 201.8 -67.1 323.9 266.1 -57.8 -38.7 36.4 -17.3 3536.7
1984 332.4 219.9 -112.5 400.2 291.1 -109.1 -94.3 35.1 -20.3 3933.2
1985 338.1 215.9 -122.2 411.0 289.1 -121.9 -118.2 25.7 -22.0 4220.3
1986 368.4 223.3 -145.1 448.6 310.0 -138.5 -147.2 15.5 -24.1 4462.8
1987 409.8 250.2 -159.6 500.6 348.9 -151.7 -160.7 14.3 -23.3 4739.5
1988 447.2 320.2 -127.0 545.7 431.1 -114.6 -121.2 18.7 -25.3 5103.8
1989 477.7 359.9 -117.7 580.1 487.0 -93.1 -99.5 19.8 -26.2 5484.4
1990 498.4 387.4 -111.0 616.1 535.2 -80.9 -79.0 28.6 -26.7 5803.1
1991 491.0 414.1 -76.9 609.5 578.3 -31.1 3.7 24.1 10.8 5995.9
1992 536.5 439.6 -96.9 656.0 616.9 -39.1 -48.0 24.2 -33.1 6337.7
1993 589.4 456.9 -132.5 713.1 642.9 -70.2 -82.0 25.3 -37.1 6657.4
1994 668.7 502.9 -165.8 801.6 703.3 -98.4 -118.0 17.1 -36.8 7072.2
1995 749.4 575.2 -174.2 890.7 794.4 -96.3 -109.5 20.9 -34.1 7397.7
1996 803.1 612.1 -191.0 955.5 851.6 -103.9 -120.2 22.3 -38.6 7816.9
1997 876.5 678.4 -198.1 1042.8 934.6 -108.2 -136.0 12.6 -40.4 8304.3
1998 917.1 670.4 -246.7 1098.4 933.5 -164.9 -209.6 3.8 -48.4 8747.0
1999 1030.0 684.0 -346.0 1229.7 966.4 -263.3 -296.8 13.2 -46.8 9268.4
2000 1224.4 772.0 -452.4 1449.3 1071.0 -378.3 -413.4 20.6 -55.7 9817.0
2001 1145.9 718.7 -427.2 1369.3 1006.7 -362.7 -385.7 23.6 -46.6 10128.0
2002 1164.7 681.8 -482.9 1397.7 975.9 -421.7 -473.9 7.2 -59.4 10487.0
2003 1260.7 713.1 -547.6 1517.0 1020.5 -496.5 -530.7 33.3 -67.4 11004.0
2004 1473.1 807.6 -665.5 1764.3 1147.2 -617.1 -665.9 24.1 -72.9 11733.5
----------------------------------------------------------------------------------------------
U.S. IMPORTS, EXPORTS, AND TRADE BALANCE: 1940-2004
(percent of GDP)
Merchan- Goods & Goods & Goods & Current Unilatrl
General dise Services Services Services Account Income current GDP
Year Imports Exports Balance Imports Exports Balance Balance Balance xfers ($bil)
---- ------- ------- ------- ------- ------- ------- ------- ------- ------- -------
1940 2.564 3.945 1.381 101.4
1941 2.605 4.025 1.421 126.7
1942 1.729 5.003 3.274 161.9
1943 1.712 6.546 4.834 198.6
1944 1.774 6.506 4.686 219.8
1945 1.883 4.393 2.510 223.1
1946 2.204 4.363 2.159 222.3
1947 2.375 5.897 3.563 244.2
1948 2.637 4.718 2.043 269.2
1949 2.469 4.527 2.020 267.3
1950 3.029 3.506 0.477 293.8
1951 3.242 4.421 1.208 339.3
1952 2.986 4.242 1.256 358.3
1953 2.873 4.164 1.292 379.4
1954 2.681 3.970 1.288 380.4
1955 2.748 3.737 1.013 414.8
1956 2.880 4.366 1.486 Goods & Goods & Goods & Current Unilatrl 437.5
1957 2.819 4.533 1.713 Services Services Services Account Income current 461.1
1958 2.740 3.831 1.092 Imports Exports Balance Balance Balance xfers 467.2
1959 3.000 3.474 0.474 ------- ------- ------- ------- ------- ------- 506.6
1960 2.804 3.733 0.929 4.261 4.928 0.666 0.536 0.642 -0.772 526.4
1961 2.669 3.692 1.023 4.077 4.847 0.770 0.702 0.689 -0.758 544.7
1962 2.777 3.549 0.772 4.158 4.734 0.575 0.578 0.733 -0.730 585.6
1963 2.760 3.606 0.846 4.114 4.795 0.682 0.715 0.744 -0.711 617.7
1964 2.818 3.843 1.025 4.117 5.024 0.907 1.028 0.760 -0.639 663.6
1965 2.991 3.680 0.688 4.258 4.907 0.649 0.755 0.744 -0.637 719.1
1966 3.236 3.720 0.485 4.568 4.941 0.373 0.385 0.641 -0.629 787.8
1967 3.227 3.683 0.456 4.652 4.964 0.313 0.310 0.633 -0.636 832.6
1968 3.625 3.695 0.070 4.977 5.005 0.027 0.067 0.658 -0.619 910.0
1969 3.637 3.698 0.062 4.990 4.999 0.009 0.041 0.614 -0.582 984.6
1970 3.839 4.089 0.251 5.237 5.454 0.217 0.224 0.600 -0.593 1038.5
1971 4.044 3.843 -0.201 5.410 5.295 -0.116 -0.127 0.645 -0.657 1127.1
1972 4.506 3.988 -0.518 5.868 5.429 -0.440 -0.468 0.662 -0.690 1238.3
1973 5.099 5.165 0.066 6.461 6.599 0.137 0.516 0.879 -0.500 1382.7
1974 6.921 6.554 -0.367 8.346 8.060 -0.286 0.131 1.034 -0.617 1500.0
1975 5.993 6.537 0.543 7.336 8.093 0.757 1.106 0.781 -0.432 1638.3
1976 6.806 6.286 -0.520 8.152 7.819 -0.333 0.235 0.880 -0.312 1825.3
1977 7.480 5.949 -1.531 8.841 7.499 -1.342 -0.706 0.893 -0.257 2030.9
1978 7.670 6.191 -1.478 9.073 7.776 -1.297 -0.660 0.889 -0.252 2294.7
1979 8.271 7.195 -1.075 9.702 8.744 -0.958 -0.011 1.204 -0.257 2563.3
1980 8.953 8.039 -0.914 10.441 9.745 -0.696 0.083 1.078 -0.299 2789.5
1981 8.473 7.577 -0.896 9.927 9.410 -0.517 0.161 1.052 -0.374 3128.4
1982 7.608 6.487 -1.121 9.198 8.456 -0.742 -0.170 1.080 -0.508 3255.0
1983 7.603 5.706 -1.897 9.158 7.524 -1.633 -1.094 1.029 -0.489 3536.7
1984 8.452 5.592 -2.860 10.174 7.401 -2.773 -2.399 0.891 -0.517 3933.2
1985 8.011 5.116 -2.895 9.737 6.850 -2.888 -2.800 0.610 -0.521 4220.3
1986 8.255 5.005 -3.251 10.051 6.947 -3.104 -3.298 0.347 -0.541 4462.8
1987 8.646 5.279 -3.367 10.561 7.361 -3.200 -3.390 0.302 -0.491 4739.5
1988 8.762 6.274 -2.488 10.692 8.448 -2.245 -2.374 0.366 -0.495 5103.8
1989 8.710 6.563 -2.147 10.578 8.880 -1.698 -1.814 0.361 -0.477 5484.4
1990 8.589 6.676 -1.913 10.617 9.223 -1.393 -1.361 0.492 -0.459 5803.1
1991 8.189 6.906 -1.283 10.165 9.646 -0.519 0.062 0.402 0.179 5995.9
1992 8.466 6.937 -1.529 10.350 9.734 -0.617 -0.757 0.382 -0.523 6337.7
1993 8.853 6.864 -1.990 10.711 9.656 -1.054 -1.232 0.380 -0.557 6657.4
1994 9.455 7.110 -2.345 11.335 9.944 -1.391 -1.669 0.242 -0.520 7072.2
1995 10.130 7.775 -2.354 12.040 10.738 -1.301 -1.480 0.282 -0.461 7397.7
1996 10.274 7.831 -2.443 12.224 10.894 -1.330 -1.538 0.286 -0.494 7816.9
1997 10.554 8.169 -2.386 12.558 11.255 -1.303 -1.637 0.152 -0.487 8304.3
1998 10.485 7.665 -2.820 12.557 10.672 -1.885 -2.396 0.043 -0.554 8747.0
1999 11.113 7.380 -3.733 13.268 10.427 -2.840 -3.203 0.142 -0.504 9268.4
2000 12.472 7.864 -4.608 14.763 10.909 -3.854 -4.212 0.210 -0.567 9817.0
2001 11.314 7.096 -4.218 13.520 9.939 -3.581 -3.808 0.233 -0.460 10128.0
2002 11.106 6.502 -4.605 13.328 9.306 -4.022 -4.519 0.068 -0.566 10487.0
2003 11.457 6.481 -4.976 13.786 9.274 -4.512 -4.823 0.302 -0.613 11004.0
2004 12.555 6.883 -5.672 15.036 9.777 -5.259 -5.676 0.205 -0.622 11733.5
------------------------------------------------------------
Note: The Current Account Balance equals the Goods and Services Balance plus the
Income Balance plus Unilateral Current Transfers, net.
Source: Historical Statistics of the United States, Colonial Times to 1970,
Series U 190,193,196 (1940-1959);
U.S. International Transactions Accounts Data, Bureau of Economic Analysis (1960-2004);
Current-dollar and "real" GDP, Bureau of Economic Analysis (1940-2004)
Go to Budget Home Page

