U.S. FEDERAL DEBTS AND LIABILITIES (billions of dollars)
Annual Related
Debt or Liability 2006 2007 Change Measure
========================== ======= ======= ======= =======
Debt Held by the Public... 4829.0 5035.1 206.2 162.0 (Unified Deficit)
Intergovernmental Debt.... 3622.4 3915.6 293.2
-------------------------- ------- ------- -------
Gross Federal Debt........ 8451.4 8950.7 499.4
Net position*............. 8916.4 9205.8 289.4 275.5 (Net Operating Cost)
Assets^................... 1496.5 1581.1 84.6
Social Insurance Exposures 38851.0 40948.0 2097.0
Other Commitments......... 1100.0
-------------------------- -------
Total Current Obligations. 52834.9
Gross Domestic Product.... 13015.5 13667.5
-----------------------------------------------------------------------------------
U.S. FEDERAL DEBTS AND LIALITIES (percent of GDP)
Annual Related
Debt or Liability 2006 2007 Change Measure
========================== ======= ======= ======= =======
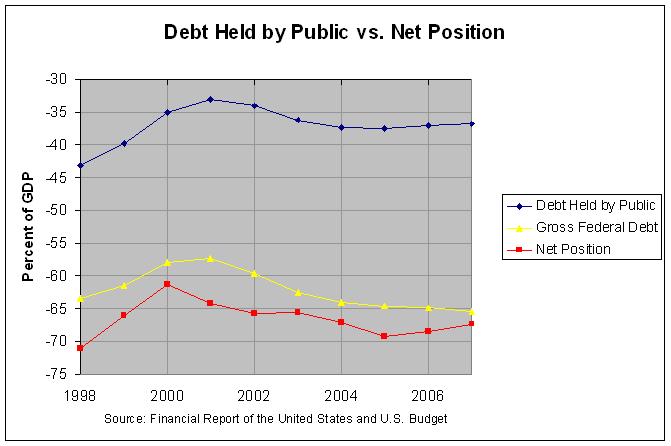
Debt Held by the Public... 37.1 36.8 1.5 1.2 (Unified Deficit)
Intergovernmental Debt.... 27.8 28.6 2.1
-------------------------- ------- ------- -------
Gross Federal Debt........ 64.9 65.5 3.7
Net position*............. 68.5 67.4 2.1 2.0 (Net Operating Cost)
Assets^................... 11.5 11.6 0.6
Social Insurance Exposures 298.5 299.6 15.3
Other Commitments......... 8.0
-------------------------- -------
Total Current Obligations. 386.6
* This is actually the negative Net Position so as to be comparable to debt.
^ Assets are added back to the negative Net Position to get Liabilities.
Source: Budget of the United States Government, FY 2009: Historical Tables,
tables 7.1 and 10.1;
Financial Report of the United States Government for Fiscal Year 2007,
Balance Sheets and Statements of Social Insurance, pages 45-47;
Other Commitments for 2007: http://www.pgpf.org/about/nationaldebt/
================================================================================
DEBT HELD BY GOVERNMENT ACCOUNTS (billions of dollars)
Investment or disinvestment Holdings
------------------------------ end of
2007 % of 2008 2009 2009 % of
Description actual total est. est. est. total
---------------------------------- ------ ----- ------ ------ ------- -----
Old-age and survivors trust fund.. 175.1 59.7 187.7 201.7 2357.6 51.7
Civil service retirement & disabil 11.7 4.0 31.8 33.4 766.9 16.8
Hospital insurance trust fund..... 17.2 5.9 -5.3 10.9 324.9 7.1
Military retirement trust fund.... 8.4 2.9 25.2 32.6 248.0 5.4
Disability insurance trust fund... 11.7 4.0 4.1 3.4 221.3 4.9
Medicare-eligible retiree health.. 19.5 6.6 41.7 25.5 159.4 3.5
Unemployment trust fund........... 8.7 3.0 9.1 8.0 92.0 2.0
Supplementary medical insurance... 6.2 2.1 9.5 7.6 56.3 1.2
Federal Deposit Insurance Corp.... 1.5 0.5 2.0 3.1 55.8 1.2
Employees life ins & health benfts 2.8 0.9 1.6 1.7 52.1 1.1
Postal Service retiree health fund 25.5 8.7 6.8 6.9 39.2 0.9
Housing and Urban Development..... 0.7 0.3 0.1 0.2 31.5 0.7
Nuclear waste disposal fund....... 1.3 0.5 0.9 0.9 21.8 0.5
Exchange stabilization fund....... 0.7 0.2 0.9 0.9 18.2 0.4
Foreign service retirement & disab 0.5 0.2 0.5 0.5 15.4 0.3
Pension Benefit Guaranty Corp..... -0.5 -0.2 -0.1 0.1 14.5 0.3
Veteran affairs life insurance.... -0.4 -0.1 -0.5 -0.5 10.7 0.2
Highway and Airport trust funds... 1.4 0.5 -4.9 -7.5 8.6 0.2
Other government accounts......... 1.2 0.4 -0.6 2.0 62.9 1.4
--------------------------------------------------------------------------------
Total investment in Federal debt.. 293.2 100.0 310.2 331.4 4557.3 100.0
Source: Budget of the United States Government, FY 2009,
Analytical Perspectives, page 236, table 16-4