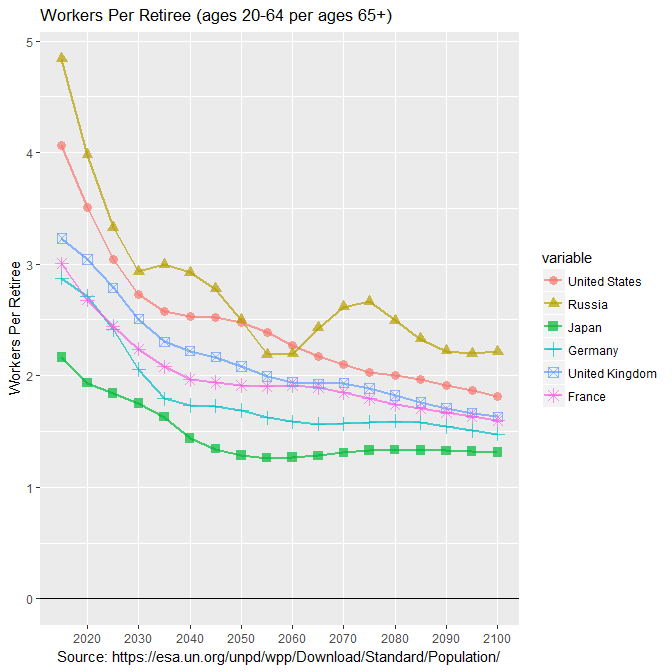
WORKERS PER RETIREE
(most populous more-developed countries)
United United
Year States Russia Japan Germany Kingdom France Italy Spain Ukraine Poland
---- ------- ------- ------- ------- ------- ------- ------- ------- ------- -------
2015 4.06 4.84 2.16 2.88 3.23 3.00 2.65 3.27 4.05 4.11
2020 3.51 3.98 1.93 2.71 3.04 2.68 2.42 2.96 3.58 3.34
2025 3.04 3.33 1.84 2.42 2.79 2.45 2.19 2.59 3.17 2.75
2030 2.73 2.94 1.75 2.06 2.51 2.24 1.91 2.23 2.89 2.54
2035 2.58 2.99 1.63 1.79 2.30 2.08 1.66 1.90 2.81 2.43
2040 2.53 2.92 1.44 1.73 2.22 1.97 1.47 1.60 2.66 2.23
2045 2.52 2.78 1.34 1.73 2.17 1.94 1.39 1.37 2.43 1.94
2050 2.48 2.50 1.28 1.69 2.08 1.91 1.38 1.29 2.14 1.64
2055 2.39 2.19 1.26 1.62 1.99 1.90 1.41 1.30 1.88 1.46
2060 2.27 2.19 1.27 1.59 1.94 1.91 1.46 1.35 1.84 1.35
2065 2.18 2.43 1.28 1.57 1.93 1.90 1.50 1.42 1.97 1.34
2070 2.10 2.61 1.31 1.57 1.93 1.85 1.51 1.45 2.14 1.38
2075 2.03 2.66 1.33 1.58 1.89 1.79 1.49 1.42 2.14 1.36
2080 2.00 2.49 1.33 1.59 1.82 1.74 1.48 1.40 2.07 1.35
2085 1.96 2.33 1.33 1.58 1.76 1.70 1.47 1.38 1.99 1.35
2090 1.92 2.22 1.33 1.55 1.71 1.67 1.46 1.37 1.92 1.36
2095 1.86 2.20 1.32 1.51 1.67 1.63 1.45 1.37 1.91 1.39
2100 1.82 2.22 1.31 1.48 1.63 1.60 1.43 1.37 1.92 1.41
----------------------------------------------------------------------------------------------
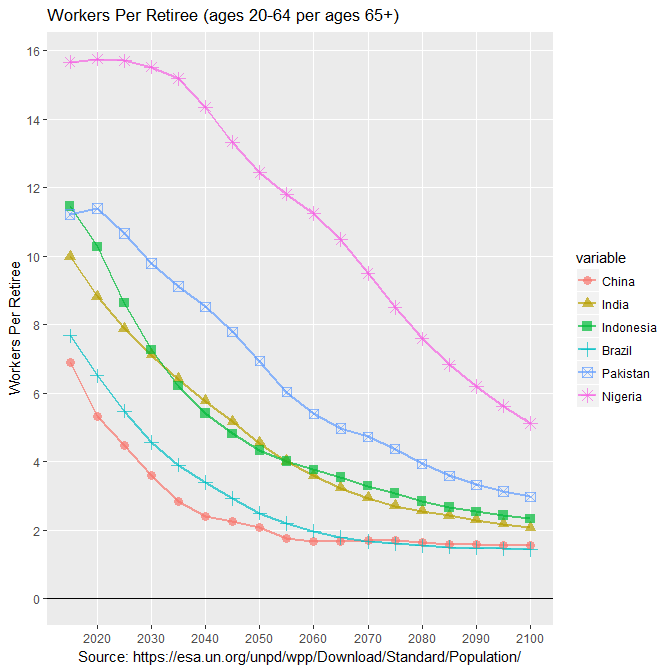
WORKERS PER RETIREE
(most populous less-developed countries)
Indo- Bangla- Phillip-
Year China India nesia Brazil Pakistan Nigeria desh Mexico pines Ethiopia
---- ------- ------- ------- ------- ------- ------- ------- ------- ------- -------
2015 6.91 9.99 11.45 7.67 11.21 15.66 11.02 8.75 11.63 12.39
2020 5.32 8.82 10.27 6.51 11.40 15.75 11.23 7.73 10.52 12.80
2025 4.49 7.89 8.63 5.48 10.66 15.70 10.09 6.77 9.29 12.92
2030 3.61 7.11 7.27 4.56 9.78 15.52 8.18 5.89 8.28 12.85
2035 2.83 6.41 6.20 3.90 9.11 15.18 6.61 5.03 7.46 12.24
2040 2.39 5.77 5.40 3.40 8.52 14.35 5.54 4.12 6.89 11.27
2045 2.25 5.16 4.81 2.92 7.79 13.33 4.57 3.53 6.38 10.21
2050 2.09 4.54 4.33 2.50 6.94 12.44 3.78 3.10 5.94 8.86
2055 1.76 4.01 4.01 2.20 6.03 11.81 3.20 2.74 5.44 7.68
2060 1.66 3.59 3.76 1.98 5.40 11.24 2.75 2.44 4.86 6.45
2065 1.69 3.23 3.54 1.79 4.97 10.48 2.38 2.18 4.40 5.35
2070 1.71 2.93 3.29 1.67 4.73 9.50 2.10 2.00 4.06 4.56
2075 1.70 2.70 3.08 1.60 4.37 8.50 1.90 1.86 3.76 4.02
2080 1.64 2.56 2.84 1.55 3.94 7.59 1.75 1.73 3.48 3.58
2085 1.59 2.42 2.67 1.50 3.59 6.83 1.64 1.63 3.23 3.22
2090 1.57 2.30 2.54 1.47 3.33 6.19 1.55 1.56 3.00 2.92
2095 1.56 2.18 2.43 1.45 3.14 5.63 1.49 1.51 2.80 2.67
2100 1.56 2.08 2.34 1.44 2.97 5.12 1.45 1.47 2.63 2.46
>
----------------------------------------------------------------------------------------------
2015 MIDYEAR POPULATION
Population More Developed Population Less Developed
(millions) Countries (millions) Countries
---------- -------------- ---------- --------------
319.93 United States 1397.03 China
143.89 Russia 1309.05 India
127.97 Japan 258.16 Indonesia
81.71 Germany 205.96 Brazil
65.40 United Kingdom 189.38 Pakistan
64.46 France 181.18 Nigeria
59.50 Italy 161.20 Bangladesh
46.40 Spain 125.89 Mexico
44.66 Ukraine 101.72 Philippines
38.27 Poland 99.87 Ethiopia
-----------------------------------------------------------------------------
Note: Workers are taken to be the population from age 20 to 64; Retirees are
taken to be the population of age 65 and above; more developed and less
developed countries are classifications employed by the United Nations.
Source: United Nations, Department of Economic and Social Affairs, Population Division (2017).
World Population Prospects: The 2017 Revision, DVD Edition.
Total Population - Both Sexes (XLSX, 2.42 MB).
Potential Support Ratio 2 (XLSX, 732 KB)
Workers Per Retiree (ages 15-64 per ages 65+)
Go to Budget Home Page