Absense of Projections for Debts and Deficits
Extremely Optimistic Economic Assumptions
Focus on Discretionary Spending
Calculation of Projections for Debts and Deficits
Absense of Projections for Debts and Deficits
On April 3, 2026, the White House released the Fiscal Year (FY) 2027 budget, containing the administration's budget priorities and proposals for the fiscal year that begins in October. The same day, the Committee for a Responsible Federal Budget released an analysis of it on their blog titled An Overview of the President's FY 2027 Budget. The analysis begins:
The Trump Administration released its Fiscal Year (FY) 2027 budget request today. While the President's budget typically presents a comprehensive plan for addressing discretionary spending, mandatory spending, and revenue for the next decade, this year's budget includes mainly a discretionary spending request and assumptions about how the economy will grow over that period.
In a section titled "Debt and Deficits Under the President's Budget", the analysis goes on to state:
The budget presents no summary figures for debt or deficits; instead, it provides a summary of its discretionary spending request alongside a reconciliation request for further defense funding. However, the various tables in the Analytical Perspectives section allow us to impute debt, deficits, spending, and revenue in both the Office of Management and Budget's (OMB) baseline and the President's budget. We find that the budget assumes debt held by the public would grow from 100% of GDP in FY 2025 to a peak of 103% of GDP by 2029 before falling to 94% by 2036.
This highlights a very curious fact about this budget. It appears that this budget and Trump's prior budget for fiscal year 2026 may be the only budgets since at least 1977 to not include projections of the debt and deficit in future years. When asked "For how long has the Budget of the United States contained projections of the debt and deficit in the Summary and Historical Tables?", ChatGPT's reply included the following:
The Budget of the United States has contained projections of deficits and debt in its Summary and Historical Tables for essentially the entire modern budget period-about five decades since the mid-1970s.
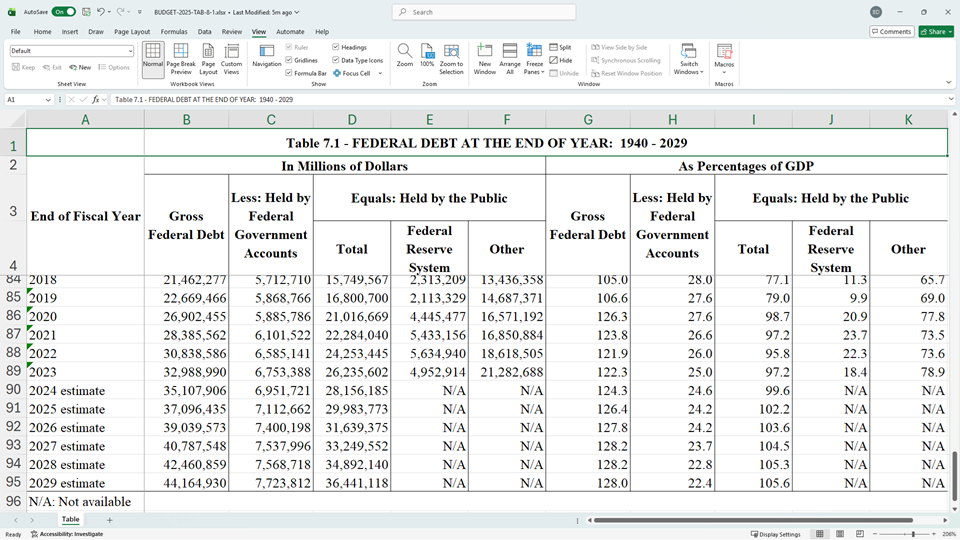
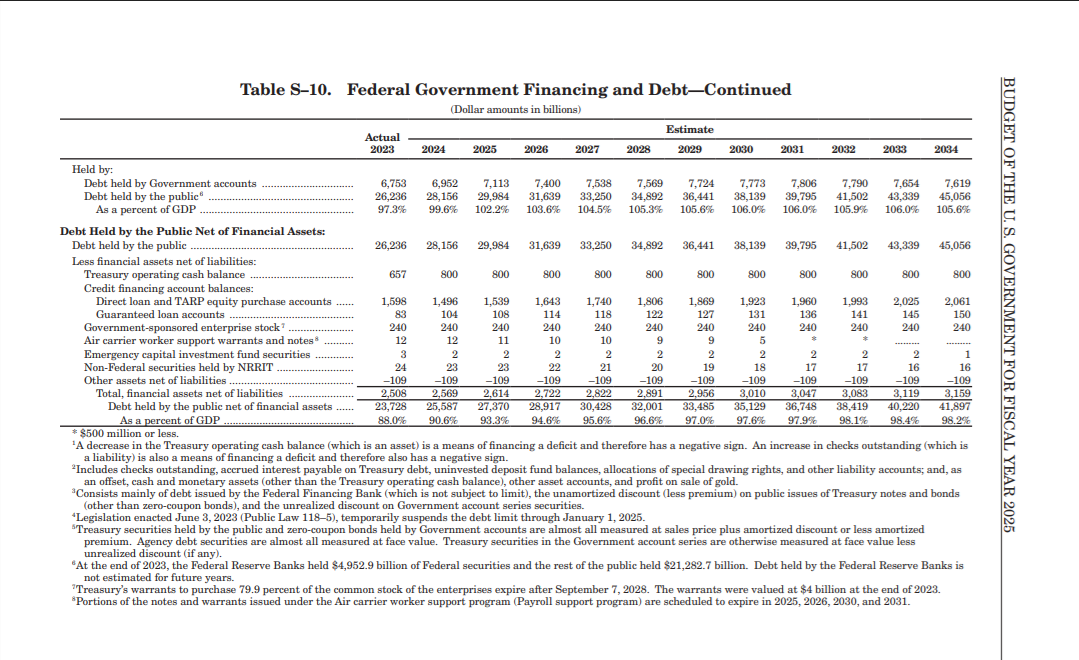
I have verified this in copies of the budget back through all those submitted by Obama. As an example of projections of the debt, following are screenshots from the relevant historical and summary tables from Biden's last budget for fiscal year 2025:
Following is a screenshot from the corresponding historical table from Trump's recent budget. That budget contained no summary table containing past or current debts, much less projected debts.
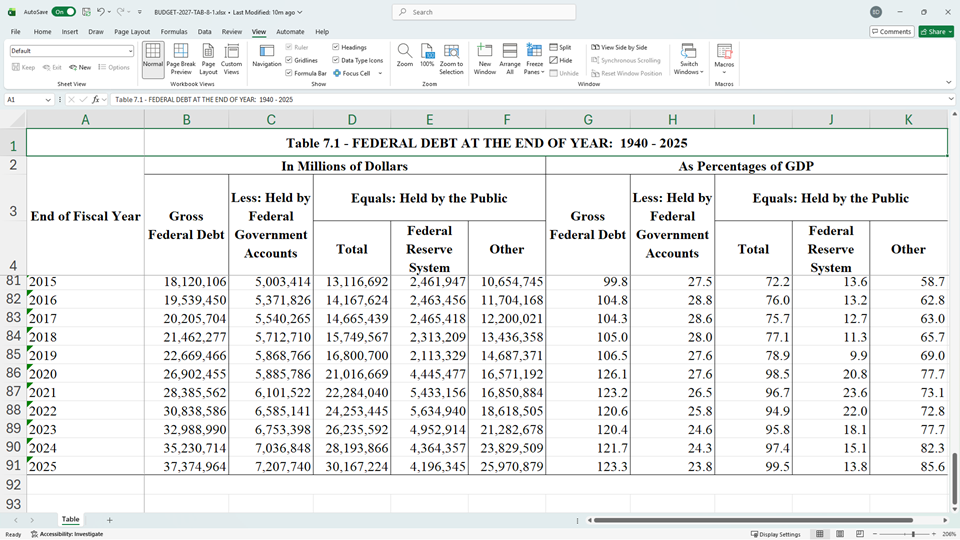
As can be seen, it contains no projections of federal debt. In addition, Table 1.1 in Trump's recent budget does not show projections of the deficit as can be seen below:
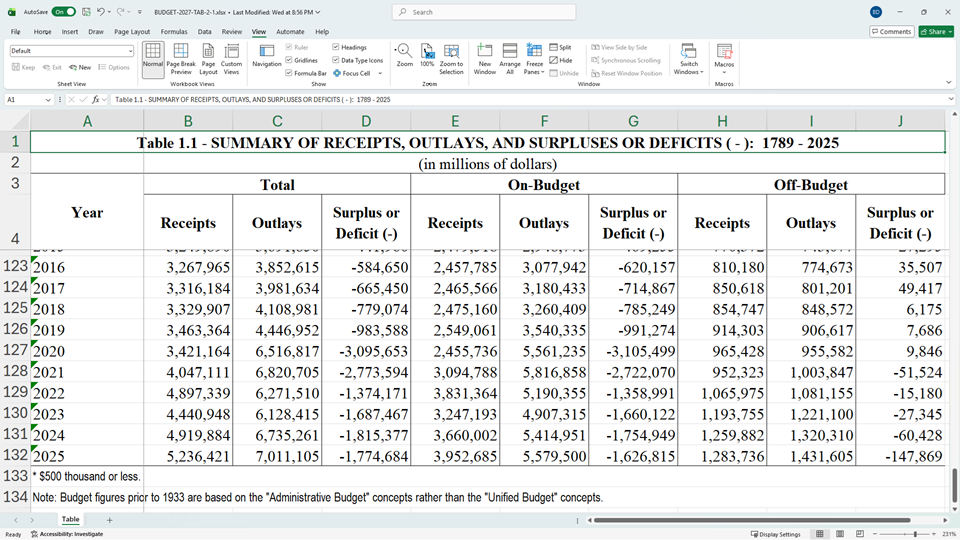
This is especially odd because Table 2.1 has projections of receipts from 2026 through 2031 and receipts before 2026 that exactly match those in the table above. Similarly, Table 3.1 has projections of outlays from 2026 through 2031 and outlays before 2026 that exactly match those shown above. From the table above, it can be seen that the deficit is simply equal to receipts minus outlays. Hence, it should have been trivial to include the projections for receipts from Table 2.1 and projections for outlays from Table 3.1 and compute the resulting projected deficits in Table 1.1 above.
Extremely Optimistic Economic Assumptions
In a section titled "Economic Assumptions in the President's Budget", the CRFB analysis begins as follows:
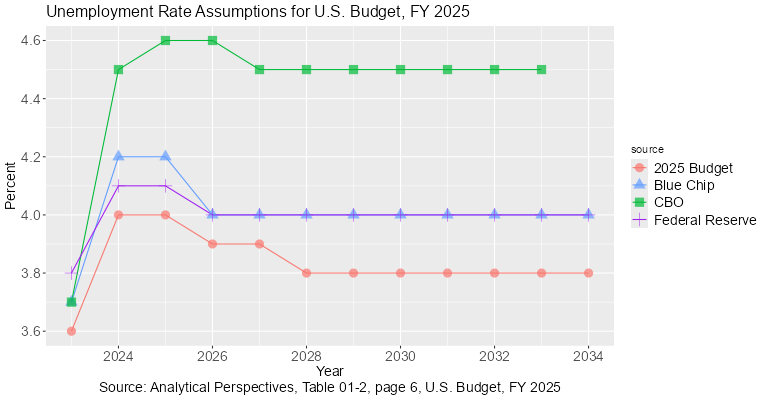
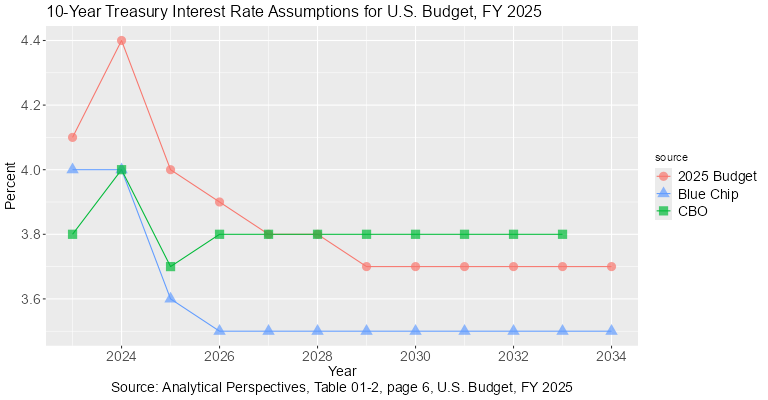
Outside of the budgetary estimates, the President's budget includes a ten-year economic forecast that is significantly more optimistic about the economy than other mainstream forecasters, such as CBO and the Federal Reserve.
The following plots show a comparison of these assumptions for real GDP growth, unemployment, and the 10-year Treasury interest rate for the next 10 years:
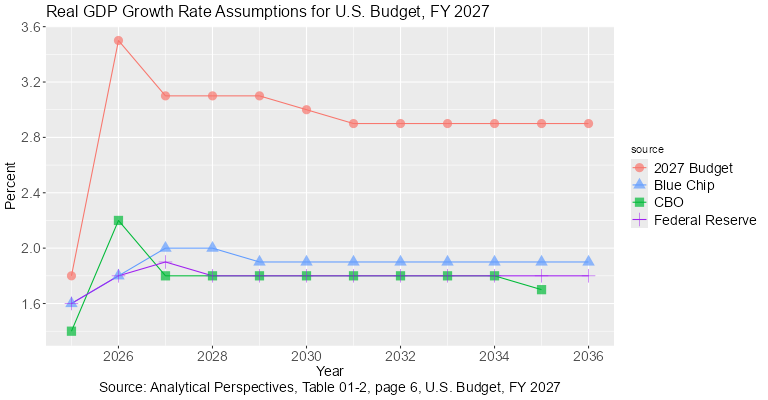
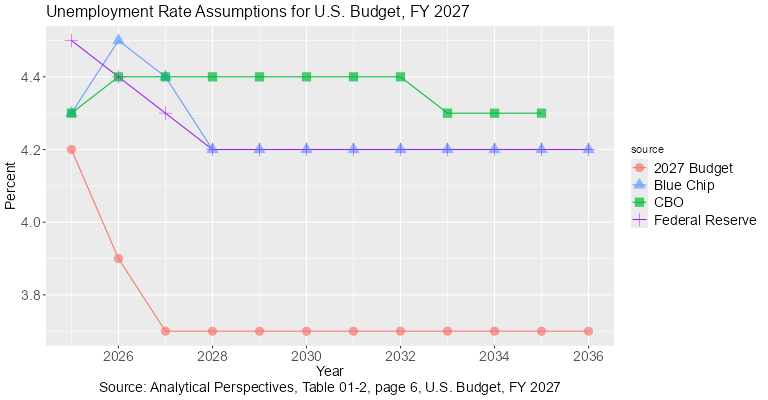
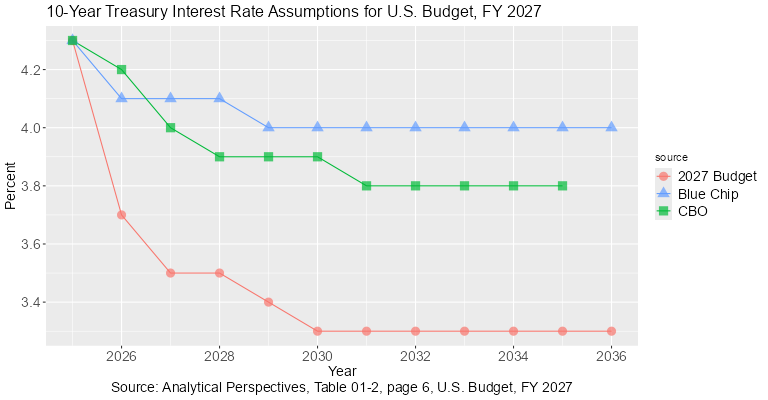
As can be seen, the budget projects real GDP growth to be nearly a full percentage greater than the CBO, Federal Reserve, and Blue Chip Economic Indidcators. Also, it projects the unemployment rate and the 10-year Treasury interest rate to be about half of a percent less than those sources.
In contrast, the following plots show a comparison of these same assumptions from Biden's last budget for fiscal year 2025:
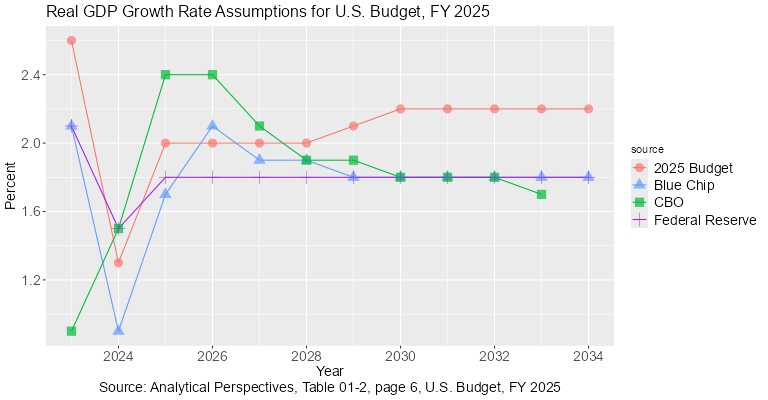
As can be seen, these assumptions are much closer to the projections of other major forecasters. The only noticable exception is unemployment where the Biden budget assumes a 0.1 to 0.2 lower unemployment rate than the Federal Reserve and Blue Chip assumptions and a 0.5 to 0.7 lower unemployment rate than the CBO assumptions.
All of the economic assumptions from the fiscal year 2025 and 2027 budgets can be viewed via the R Shiny app at https://econdata.shinyapps.io/assump1/.
Focus on Discretionary Spending
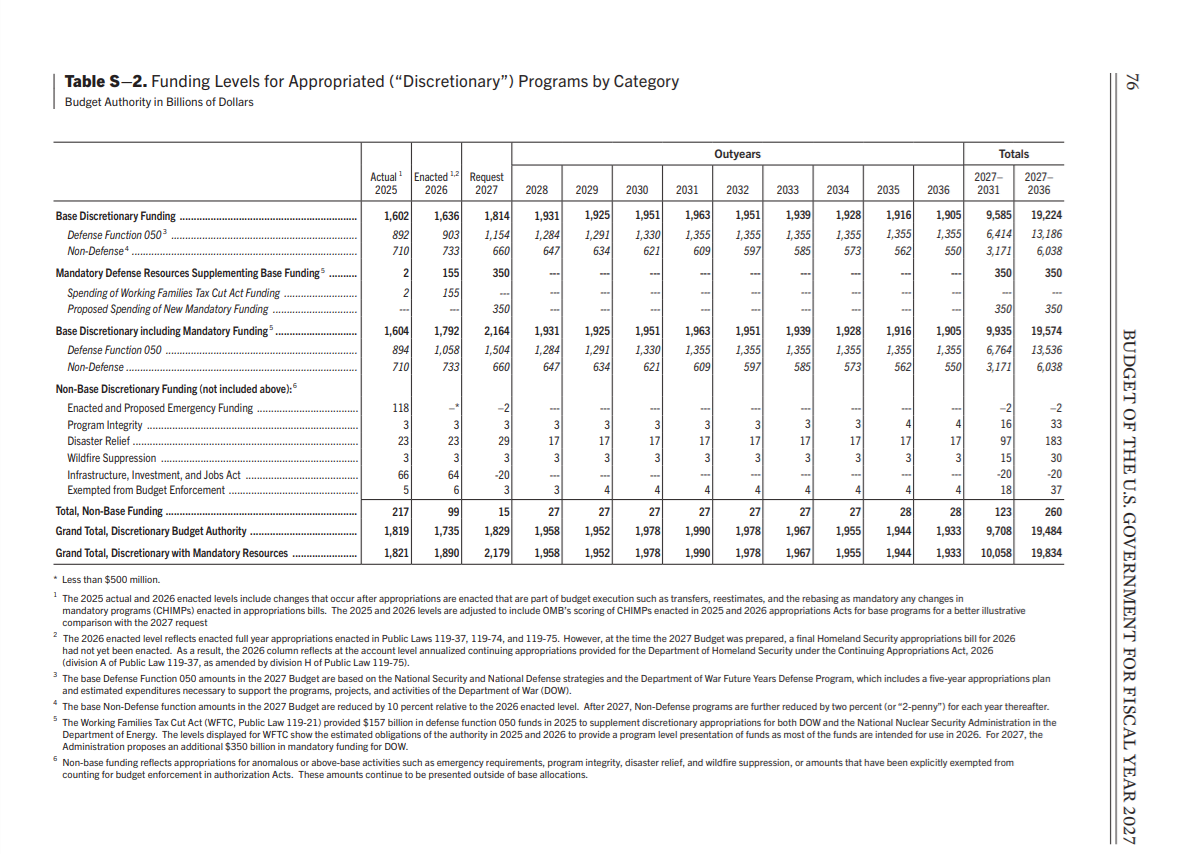
As previously mentioned, the CRFB analysis states that "this year's budget includes mainly a discretionary spending request and assumptions about how the economy will grow over that period". Following is Summary Table S-2 which shows the discretionary spending request and the projected levels of discretionary spending through 2036:
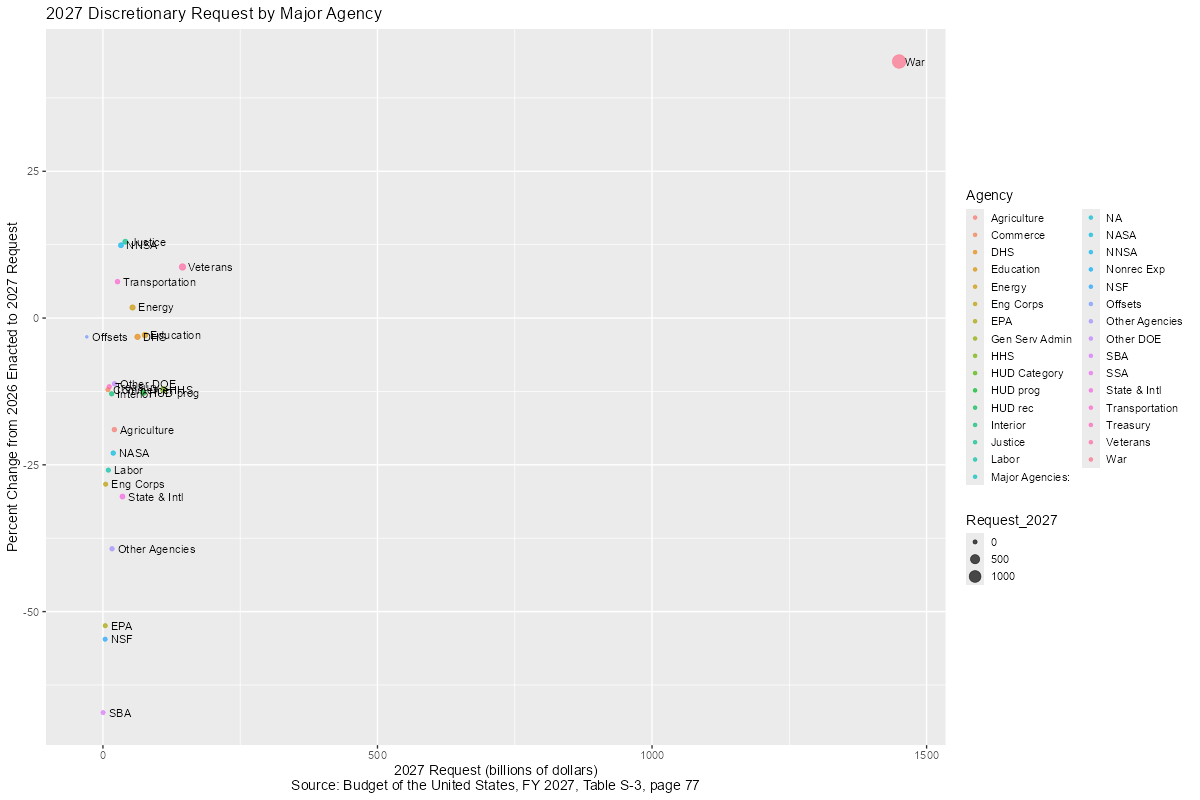
The following plot and table show the discretionary spending request for 2027 and it's percent change from the spending enacted in 2026:
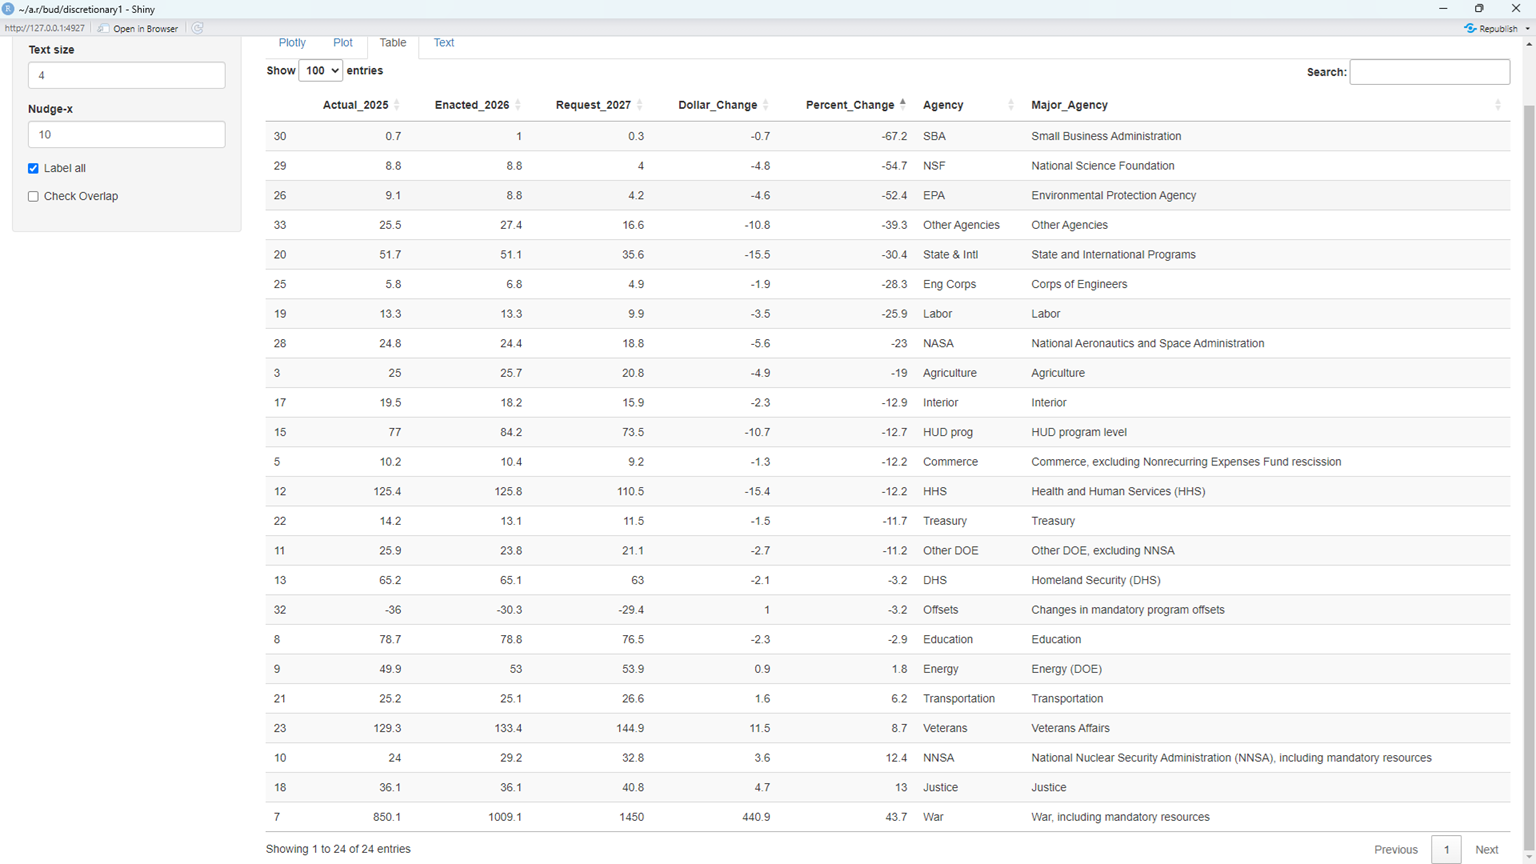
An interactive version of this plot and table can be found in the R Shiny app at https://econdata.shinyapps.io/discretionary1/.
As can be seen, the request for the War Department was by far the largest at $1.45 trillion. It also had the largest increase of 43.7 percent. In addition, there were increases in Justice of 13%, National Nuclear Security Administration (NNSA) of 12.4%, Veteran's Affairs of 8.7%, Transportation of 6.2%, and Energy of 1,8%. The largest percentage decreases were to the Small Business Adminstration (SBA) of -67.2%, National Science Foundation (NSF) of 54.7%, Environmental Protection Agency of 52.4%, State and International Programs of 30.4%, the Corps of Engineers of 28.3%, Labor of 25.9%, and NASA of 23%.
Regarding these requested cuts, an analysis in the New York Times titled Trump Budget Does Little to Address Nation's Fiscal Challenges stated the following:
What the White House presented as its fiscal outlook relied on spending cuts that would be difficult to get through Congress and projections of strong government revenue, fueled by tariffs and bounding economic growth.
Calculation of Projections for Debts and Deficits
The previously mentioned New York Times analysis included the following quote:
"It's the most number-free budget we've seen in recent history," said Maya MacGuineas, the president of the bipartisan Committee for a Responsible Federal Budget. "I have to imagine that there's a story that the numbers would tell that they don't want to tell."
In addition, the prviously mentioned analysis from the Committee for a Responsible Federal Budget stated the following:
The budget presents no summary figures for debt or deficits; instead, it provides a summary of its discretionary spending request alongside a reconciliation request for further defense funding. However, the various tables in the Analytical Perspectives section allow us to impute debt, deficits, spending, and revenue in both the Office of Management and Budget's (OMB) baseline and the President's budget.
The following table lists a number of projections that can be found in the Analytical Perspectives and Historical Tables of the budget than can be used to impute those items:
RECEIPTS, OUTLAYS, SURPLUS / DEFICIT (-), DEBT from the BUDGET OF THE UNITED STATES, FISCAL YEAR 2027

                                 Year     2025     2026     2027     2028     2029     2030     2031     2032     2033     2034     2035     2036  Source
                         HT1 Receipts   5.2364                                                                                                     HT: Table 1.1
                          HT Receipts   5.2364   5.4757   5.9210   6.2884   6.6603   7.1373   7.5594                                               HT: Table 2.1
                         AP8 Receipts   5.2364   5.4757   5.9210   6.2884   6.6603   7.1373   7.5594   7.9843   8.4468   8.8913   9.3608   9.8461  AP: Table 08-1, page 73
                          AP Receipts   5.2364   5.4757   5.9210   6.2884   6.6603   7.1373   7.5594   7.9843   8.4468   8.8913   9.3608   9.8461  AP: Table 12-4, page 134
                          HT1 Outlays   7.0111                                                                                                     HT: Table 1.1
                           HT Outlays   7.0111   7.5404   8.0929   8.4454   8.6532   8.9963   9.2798                                               HT: Table 3.1
                           AP Outlays   7.0110   7.5410   7.9450   8.2860   8.5450   8.9420   9.2650   9.6960  10.2840  10.5990  10.9040  11.5290  AP: Table 12-1, page 131
                          HT1 Deficit  -1.7747                                                                                                     HT: Table 1.1
                           HT Deficit  -1.7747  -2.0647  -2.1719  -2.1570  -1.9929  -1.8590  -1.7204                                               HT: Tables 2.1, 3.1 calculated
                           AP Deficit  -1.7746  -2.0653  -2.0240  -1.9976  -1.8847  -1.8047  -1.7056  -1.7117  -1.8372  -1.7077  -1.5432  -1.6829  HT: Tables 12-1, 12-4 calculated

           HT Debt Held by the Public  30.1672  32.2320  34.4039  36.5608  38.5537  40.4127  42.1331                                               HT: Tables 2.1, 3.1, 7.1 estimated
           AP Debt Held by the Public  30.1672  32.2325  34.2565  36.2541  38.1388  39.9435  41.6491  43.3608  45.1980  46.9057  48.4489  50.1318  AP: Tables 11-1, 12-1, 12-4 estimated
                HT Gross Federal Debt  37.3750  39.4397  41.6116  43.7686  45.7615  47.6205  49.3409                                               HT: Tables 2.1, 3.1, 7.1 estimated
                AP Gross Federal Debt  37.3750  39.4403  41.4643  43.4619  45.3466  47.1513  48.8569  50.5686  52.4058  54.1135  55.6567  57.3396  AP: Tables 11-1, 12-1, 12-4 estimated

AP Debt Held by the Public (% of GDP)  99.4862 100.4879 101.3716 102.0093 102.0518 101.6762 100.9577 100.1520  99.4762  98.3699  96.8223  95.4619  AP: Tables 11-1, 12-1, 12-2. 12.4 estimated
     AP Gross Federal Debt (% of GDP) 123.2563 122.9589 122.7009 122.2901 121.3384 120.0237 118.4295 116.8001 115.3398 113.4859 111.2266 109.1871  AP: Tables 11-1, 12-1, 12-2. 12.4 estimated
         Gross Domestic Product (GDP)  30.3230  32.0760  33.7930  35.5400  37.3720  39.2850  41.2540  43.2950  45.4360  47.6830  50.0390  52.5150  AP: Table 12-2, page 134

              HT Outlays - AP Outlays   0.0001  -0.0006   0.1479   0.1594   0.1082   0.0543   0.0148

Key:
  HT: Historical Tables FY 2027, https://www.govinfo.gov/app/collection/budget/2027/BUDGET-2027-TAB
  AP: Analytical Perspectives FY 2027, https://www.govinfo.gov/app/details/BUDGET-2027-PER
Note: The above table can be downloaded from https://www.econdataus.com/bud/budget_numbers1.csv
As can be seen, 10 years of projected Receipts and Outlays can be obtained from tables in the Analytical Perspectives. In the Historical Tables, five years of projected Receipts and Outlays can be obtained. From Historical Table 1.1, it can be seen that the Surplus / Deficit (-) is equal to the Receipts minus the Outlays. Despite the fact that only a simple subtraction operation is required, projections of the deficit are not supplied in either the Analytical Perspectives or the Historical Tables. The table above shows this calculation. The calculations show that the deficit is projected to rise from the current $1.77 trillion to $2.02 trillion in 2026 and then decline to $1.68 trillion in 2036. The Historical Tables shows slightly different numbers through 2031, reaching $2.17 trillion in 2027. This difference is due to an difference in projected outlays between the Historical Tables and Analytical Perspectives (shown in the last row).
In regards to the debt, the table above shows estimates debt projections that can be obtained from these numbers. The reason why this projections are just estimates can be explained via the following plot:
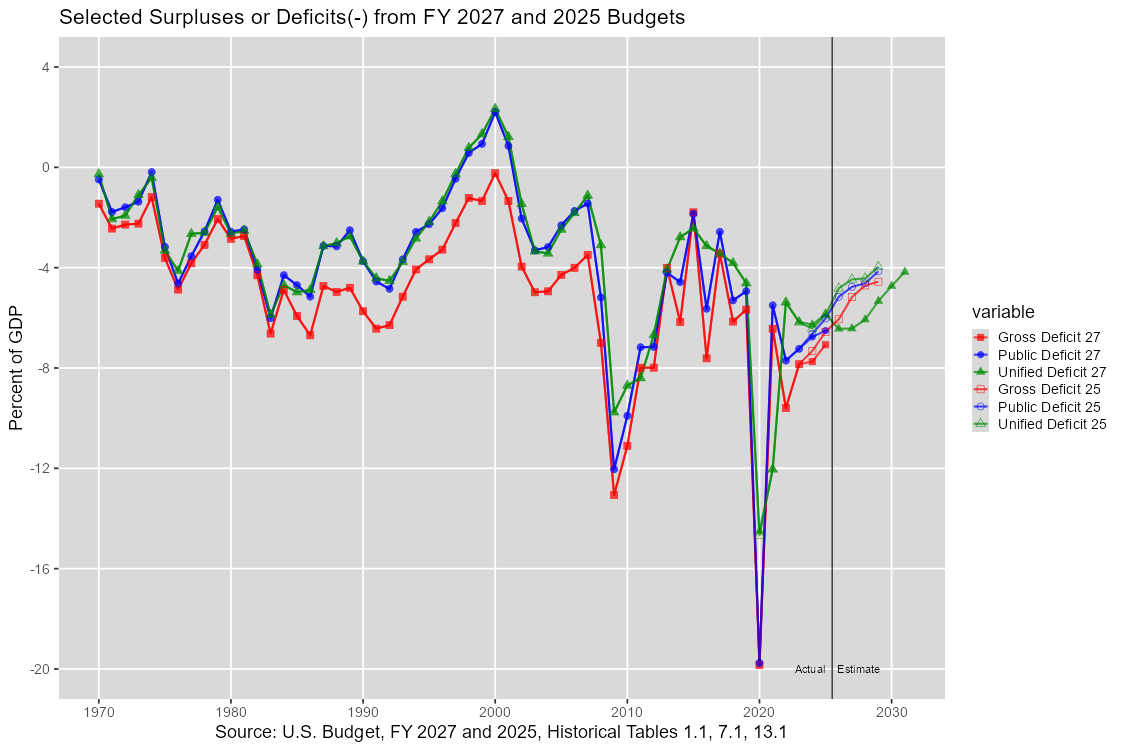
In the above plot, the green line is the "unified deficit" and the blue line is the change in the debt held by the public (called "public debt" here). As can be seen, they were very nearly equal from 1970 to 2007 but has differed more noticably in years since then. When asked "what is the difference between the unified deficit and the change in the debt held by the public?", following is some of what ChatGPT replied:
They would be identical in a very simple world-but in reality they diverge due to several technical factors:
a) Financing vs. accounting adjustments
The deficit is an accounting measure. Debt change is a cash financing measure.
b) Financial transactions that don't count in the deficit
These increase borrowing but are not counted as spending in the deficit, such as:
Student loan disbursements
Troubled asset purchases (e.g., bank rescues)
Changes in federal credit programs
These can increase debt without increasing the deficit.
Troubled asset purchases did occur following 2007, during the financial crisis. In any case, unified deficits and the change in the public debt appear to be very close on average over time. Still, they are not equal year-to-year and that is why the projections of the Debt Held by the Public are called estimates. The plot above suggests that the change in the Gross Federal Debt tends to be a little larger than these two measures. Hence, the estimate of the Gross Federal Debt is a rougher estimate and is likely a little bit on the low side.
The following chart appears in the prviously mentioned CRFB analysis:
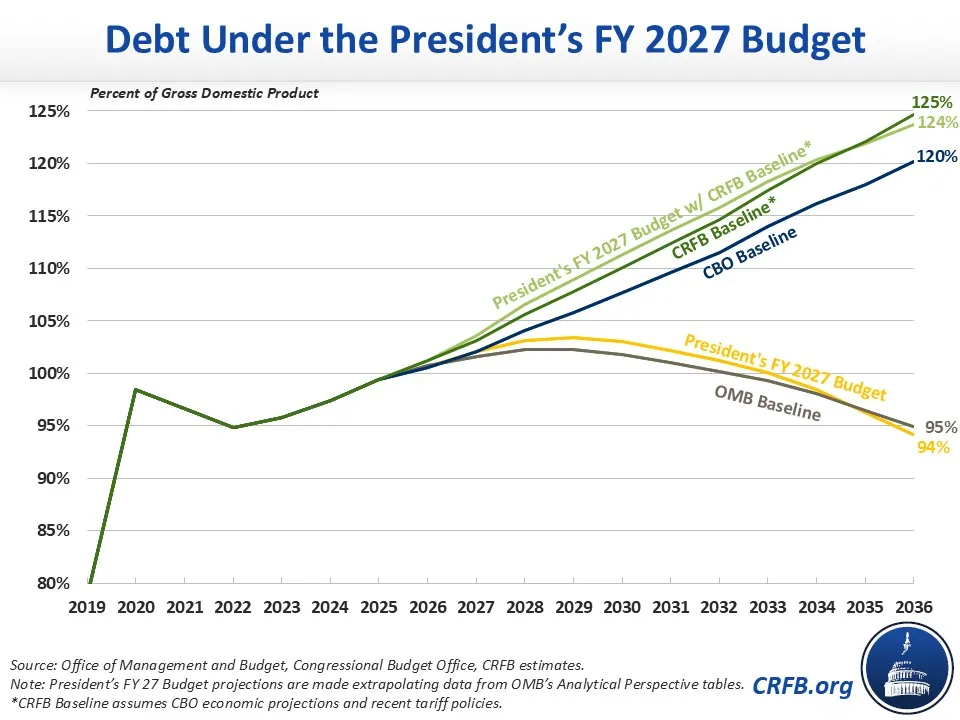
Just before the chart, the analysis states:
Many of the fiscal improvements in the budget arise from the generous assumption of 3% average annual real GDP growth over the next decade. As a result of that growth, the budget's own baseline shows debt peaking at 102% of GDP by FY 2029 and then falling to 95% by 2036.
Those numbers appears to closely match the estimates for "AP Debt Held by the Public (% of GDP)" estimated in the table above.