| Pair | Topic |
Observation |
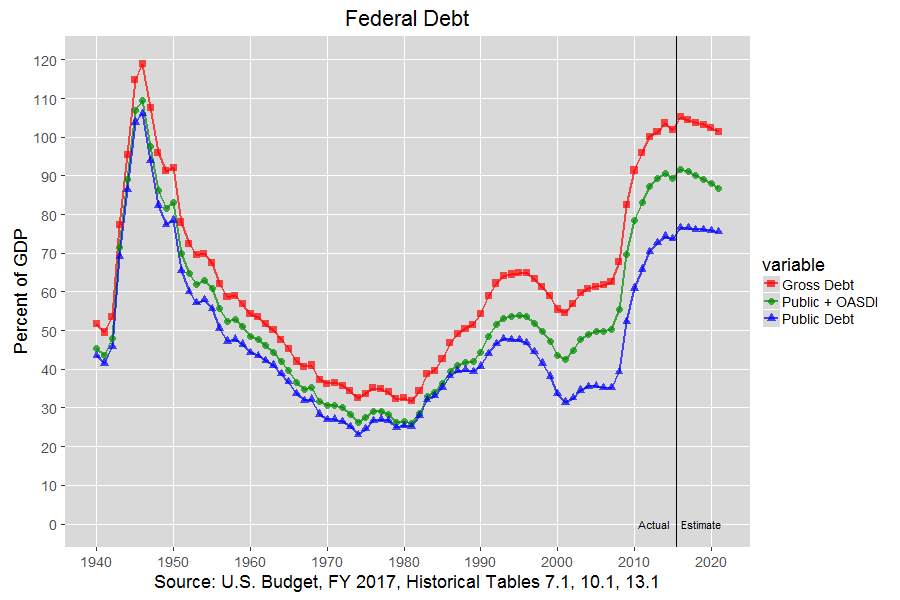
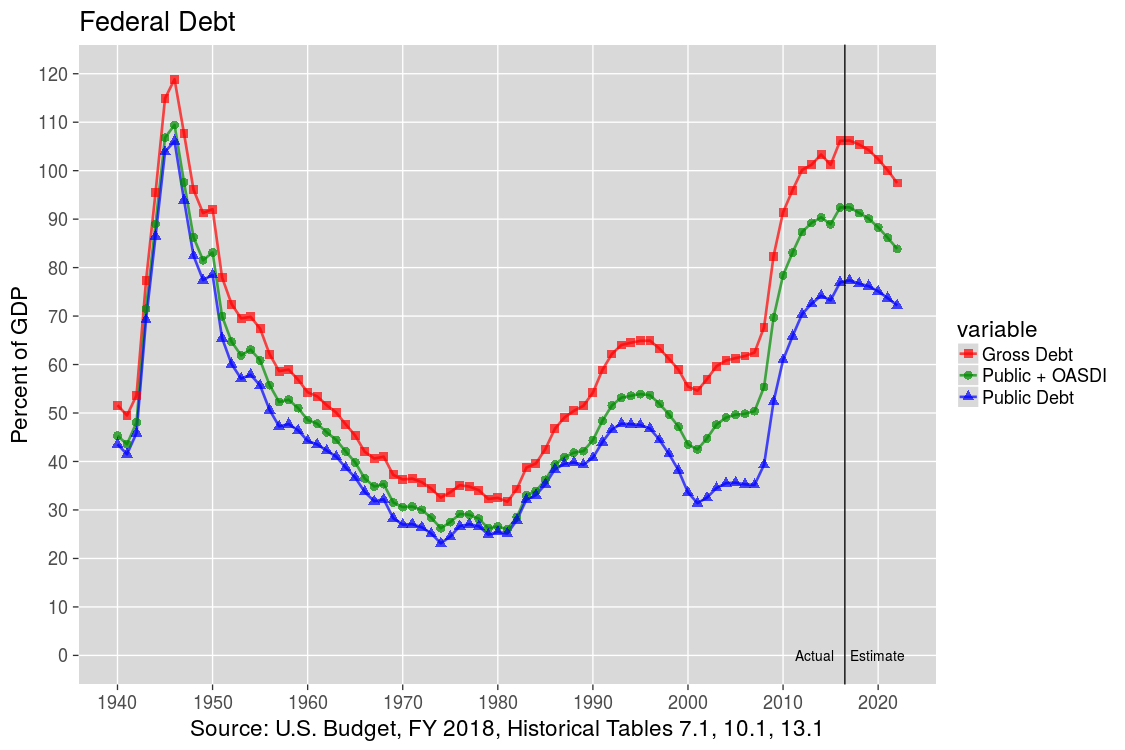
| 1 | Debt |
Trump projects that the debt will decrease faster than Obama. |
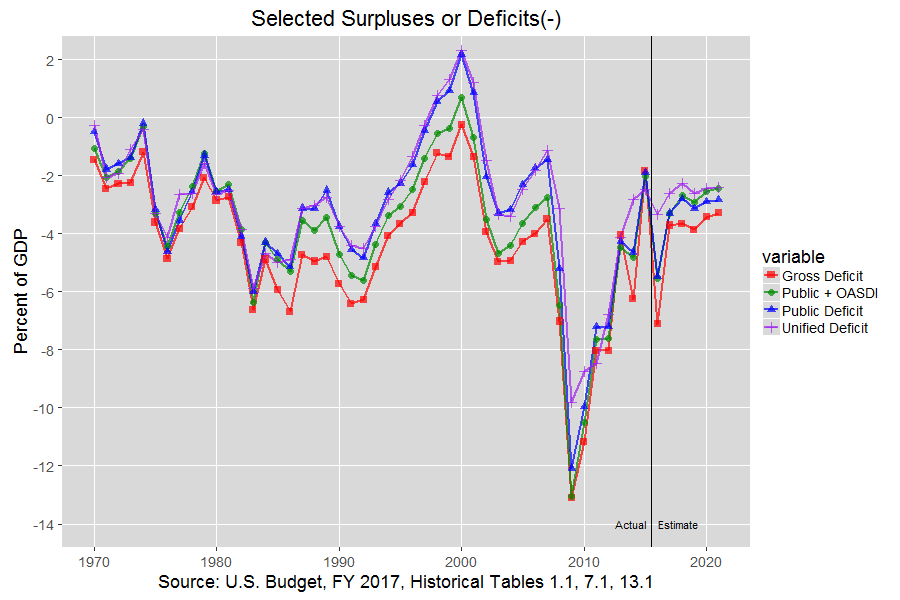
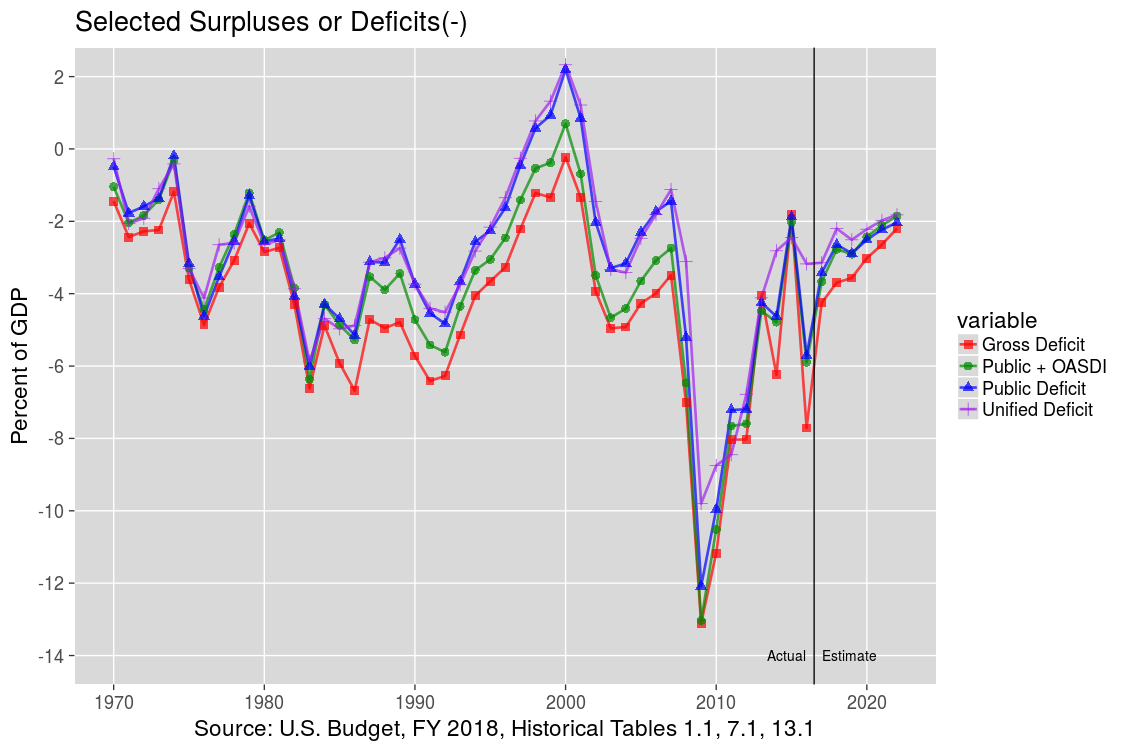
| 2 | Deficit |
Trump projects that the deficit will decrease faster than Obama. |
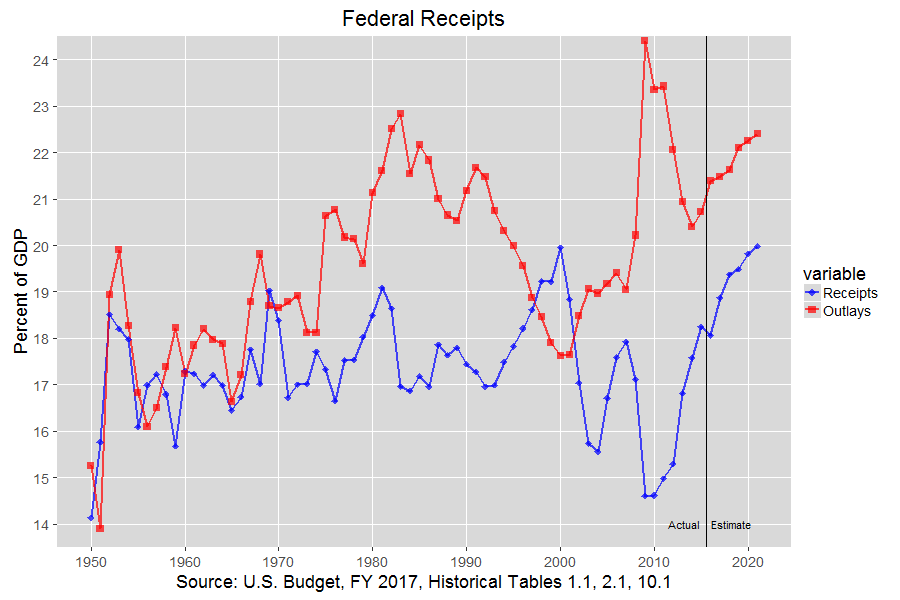
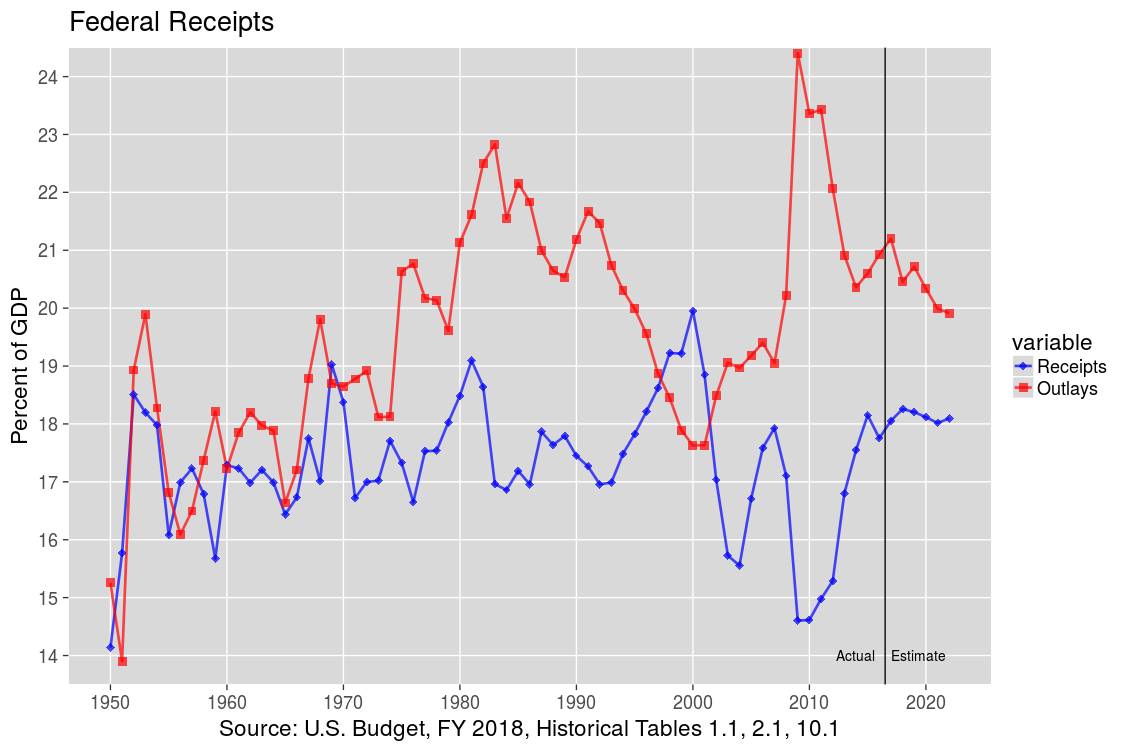
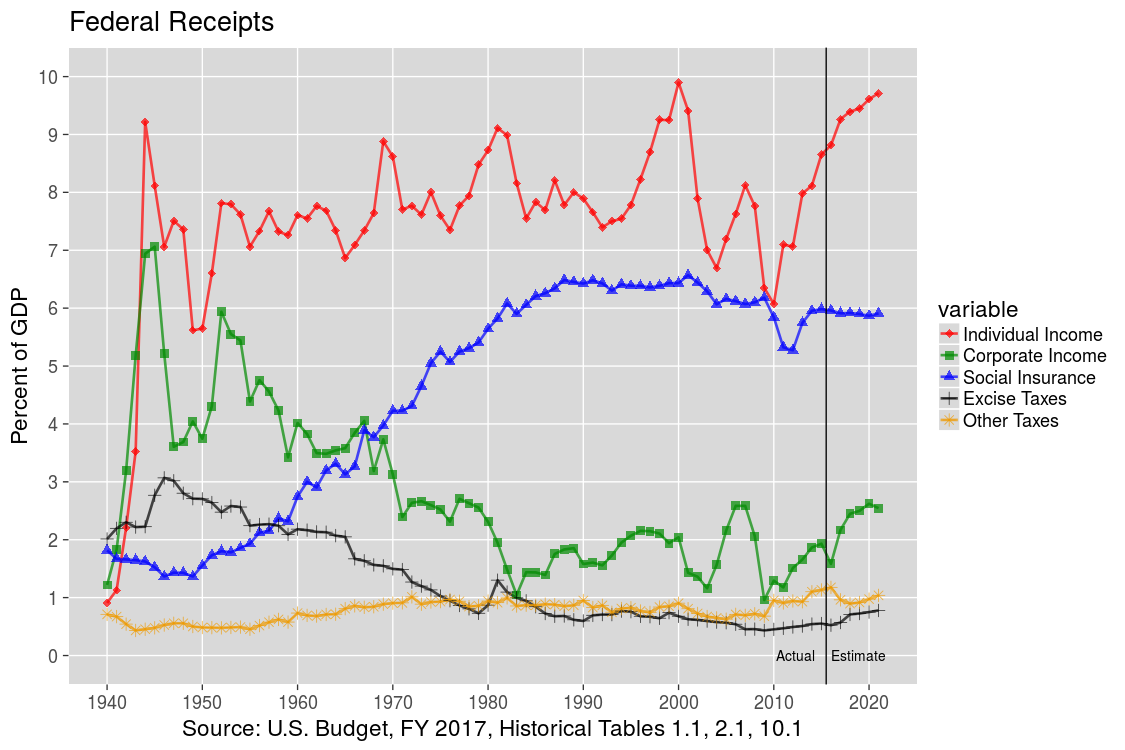
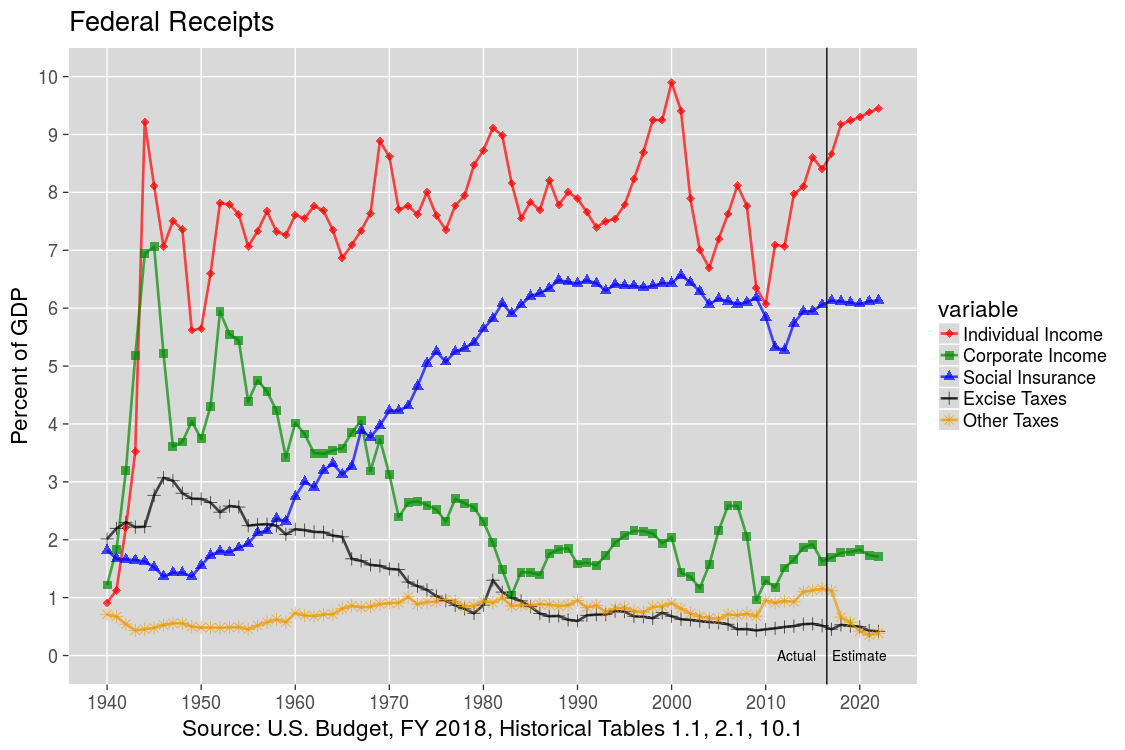
| 3 | Receipts |
Trump projects that outlays will decrease and receipts will stabilize as a percent of GDP. Obama had projected that both would increase. |
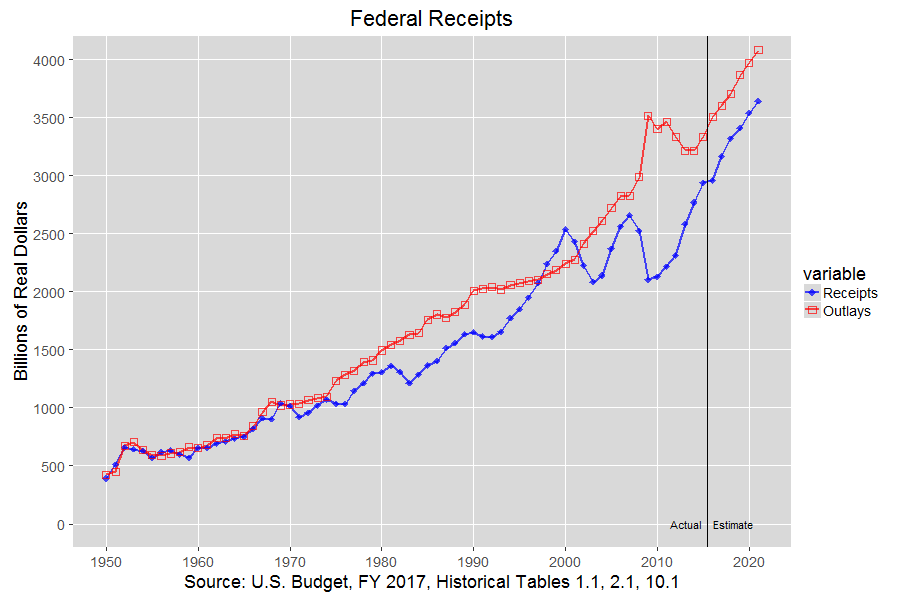
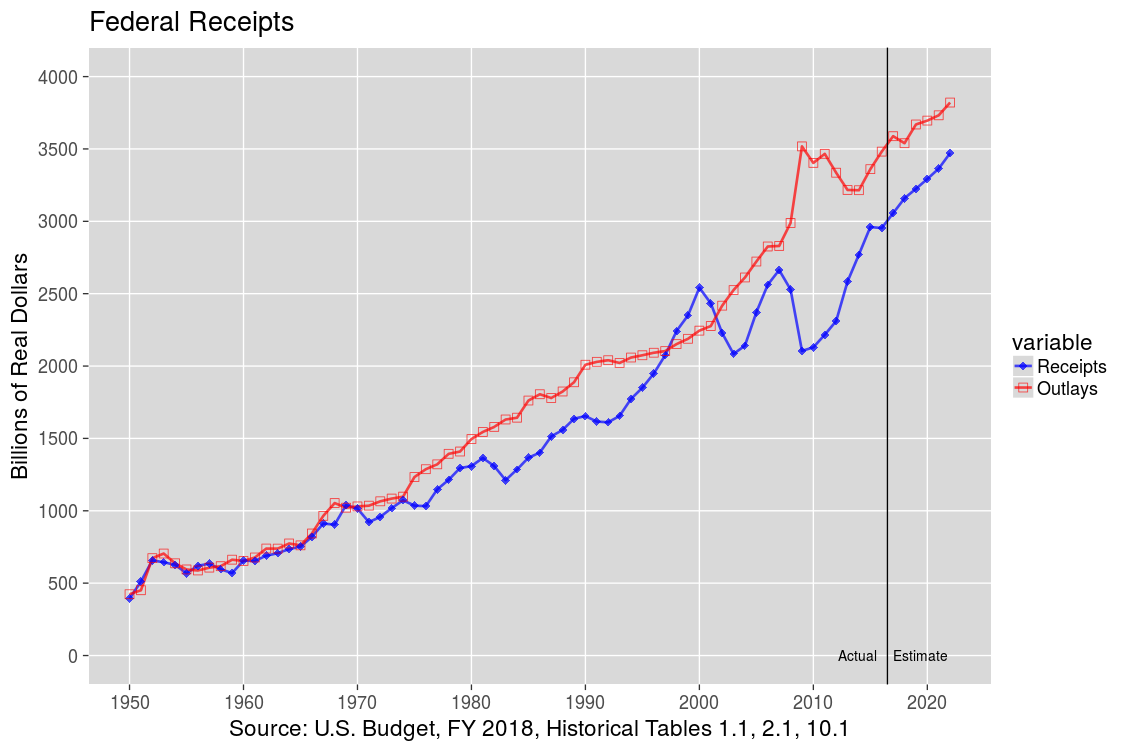
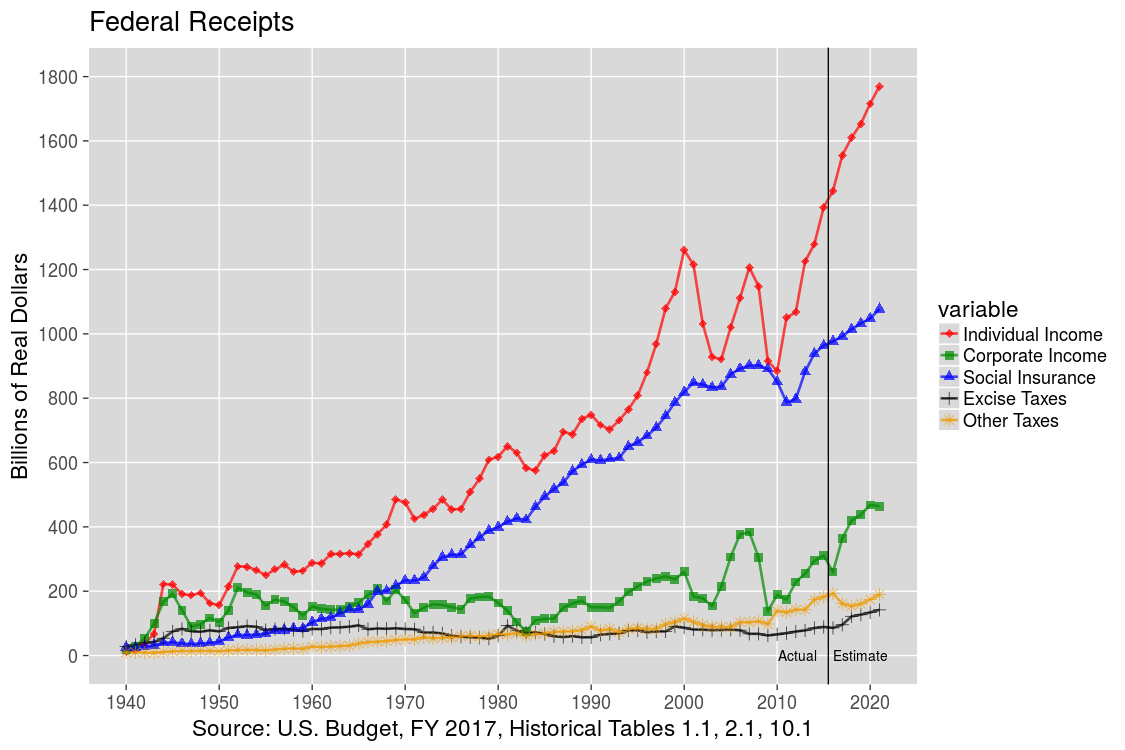
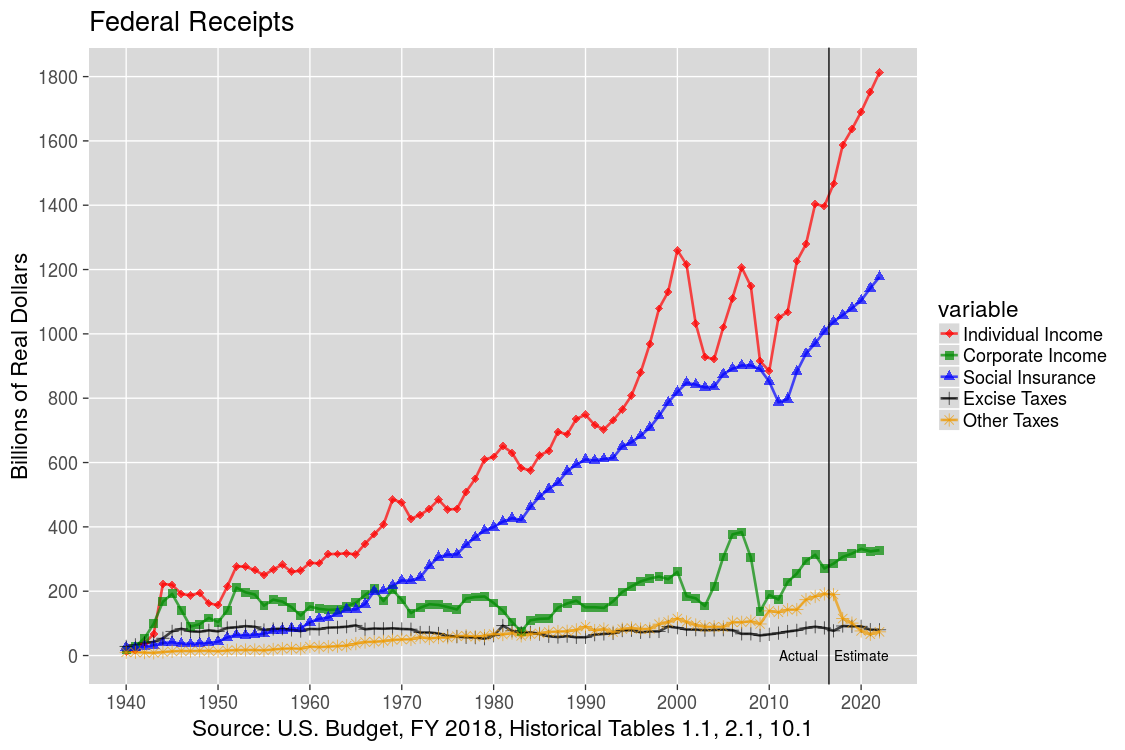
| 4 | Receipts |
Trump projects that receipts and outlays will increase in real dollars but at a slower rate than Obama. |
| 5‑6 | Receipts |
Trump projects that corporate tax receipts will stabilize and other tax receipts will drop (likely due to repealing the estate tax) as a percent of GDP. Obama had projected that corporate tax receipts would rise and that other tax receipts would stabilize. |
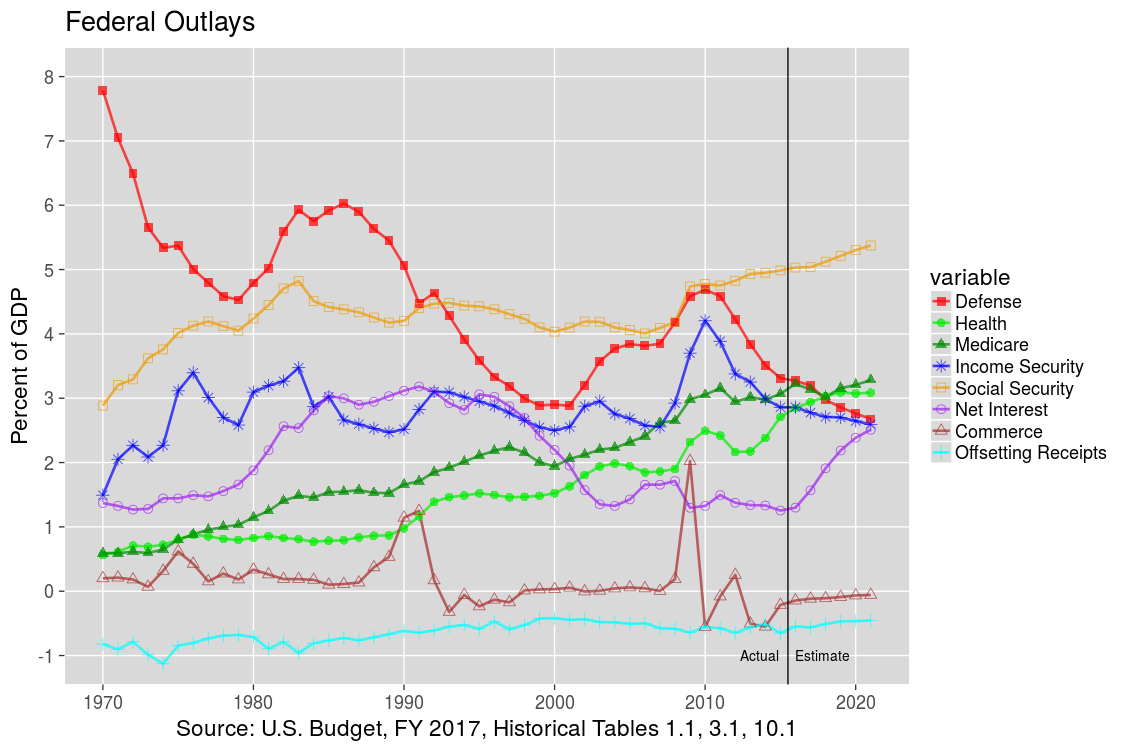
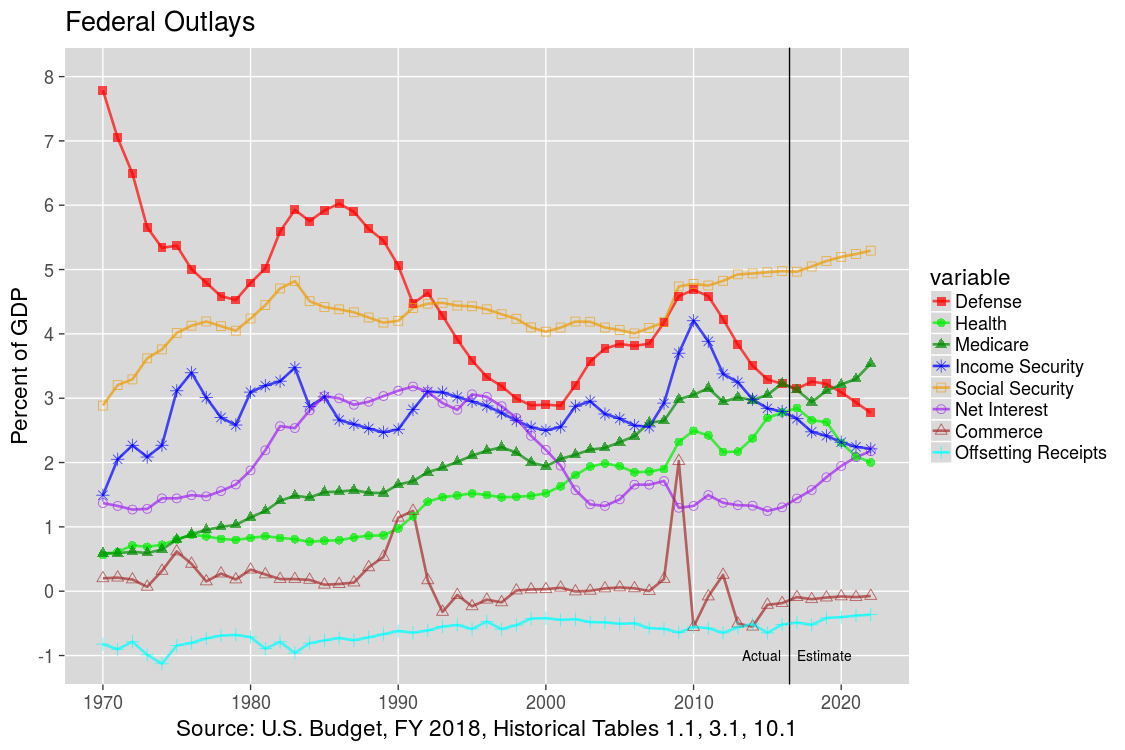
| 7‑8 | Outlays |
Trump projects that outlays for Health (which is chiefly Medicaid) will decline from nearly 3 percent of GDP to about 2 percent of GDP whereas Obama had projected that it would rise to slightly above 3 percent of GDP. Also, Trump projects a short-term bump for Defense, a sharper decrease for Income Security, and a slower rise in Net Interest than Obama projected. |
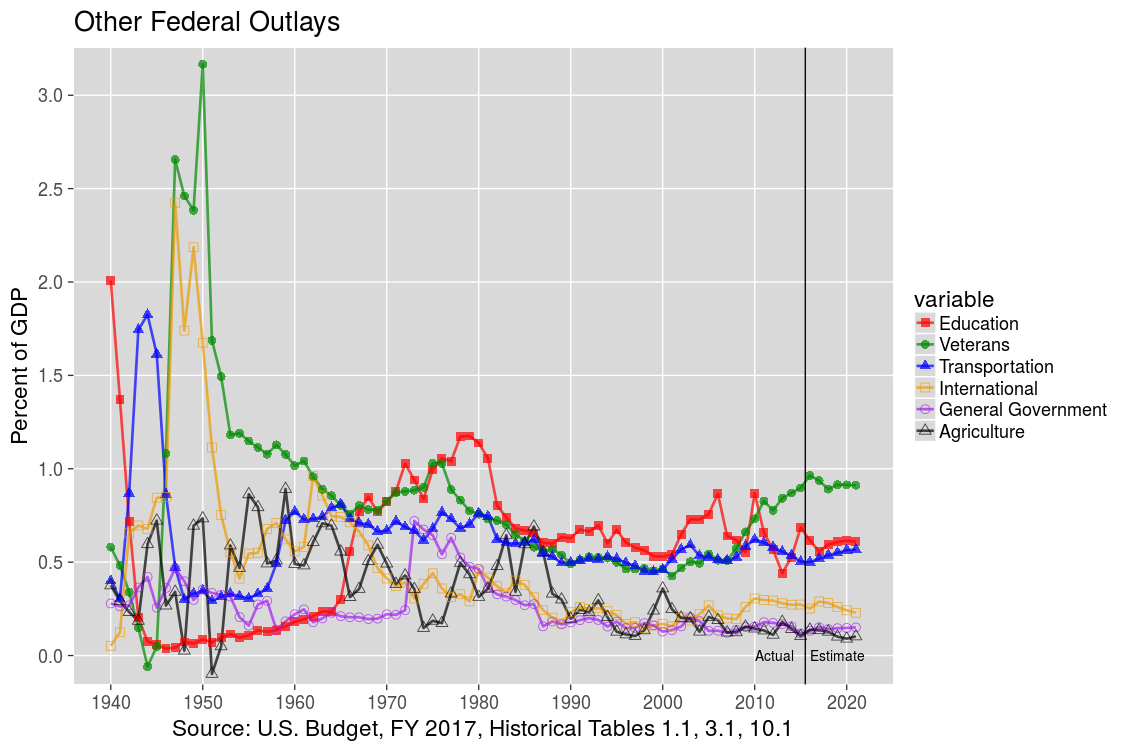
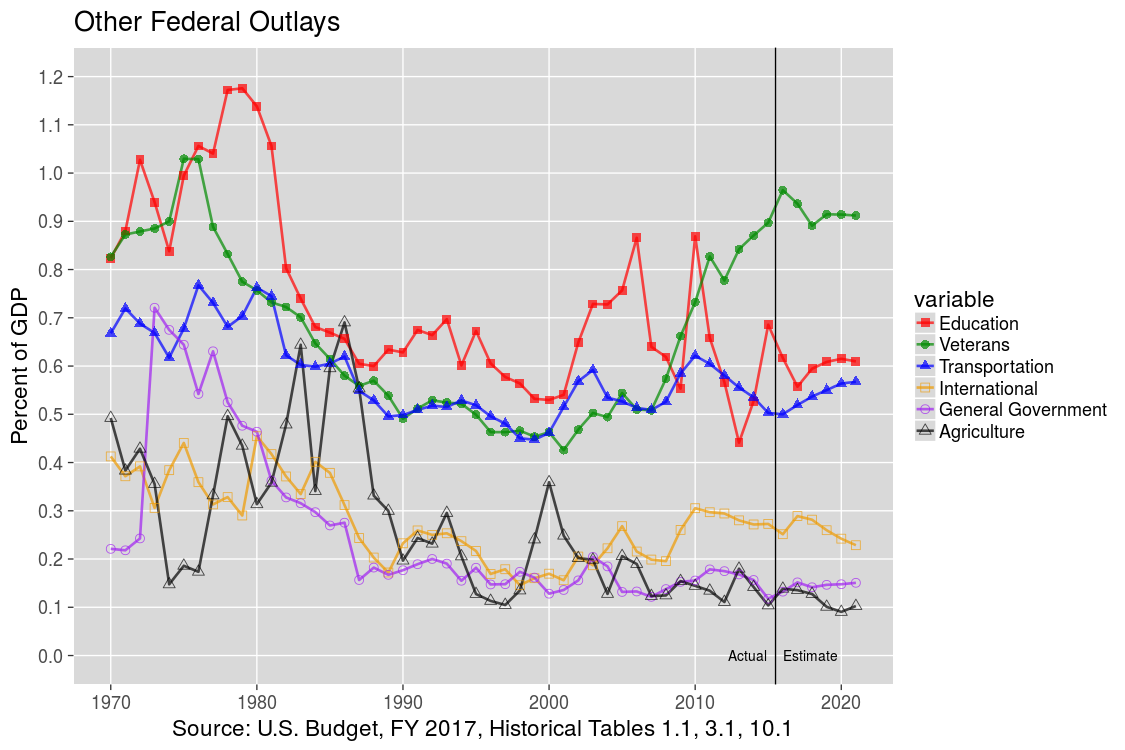
| 9‑10 | Outlays |
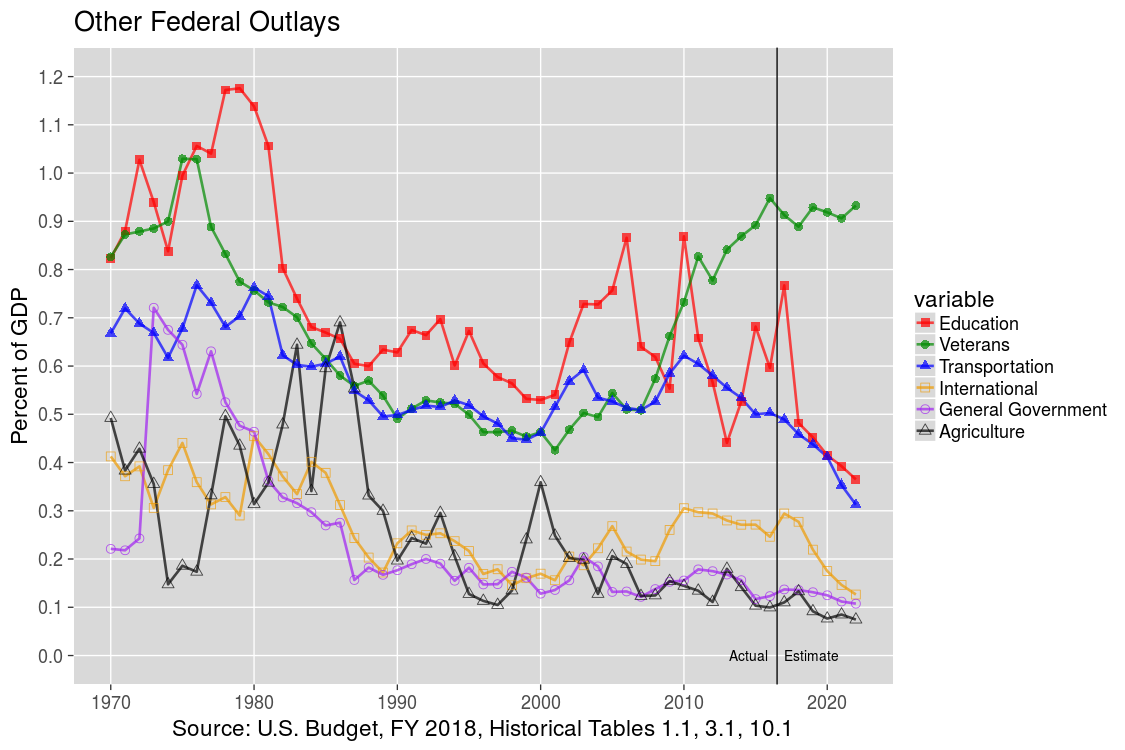
Trump projects sharply lower outlays for Education, Transportation, International, General Government, and Agriculture. Obama had projected increases in Education and Transportation and fairly steady outlays in the other areas. |
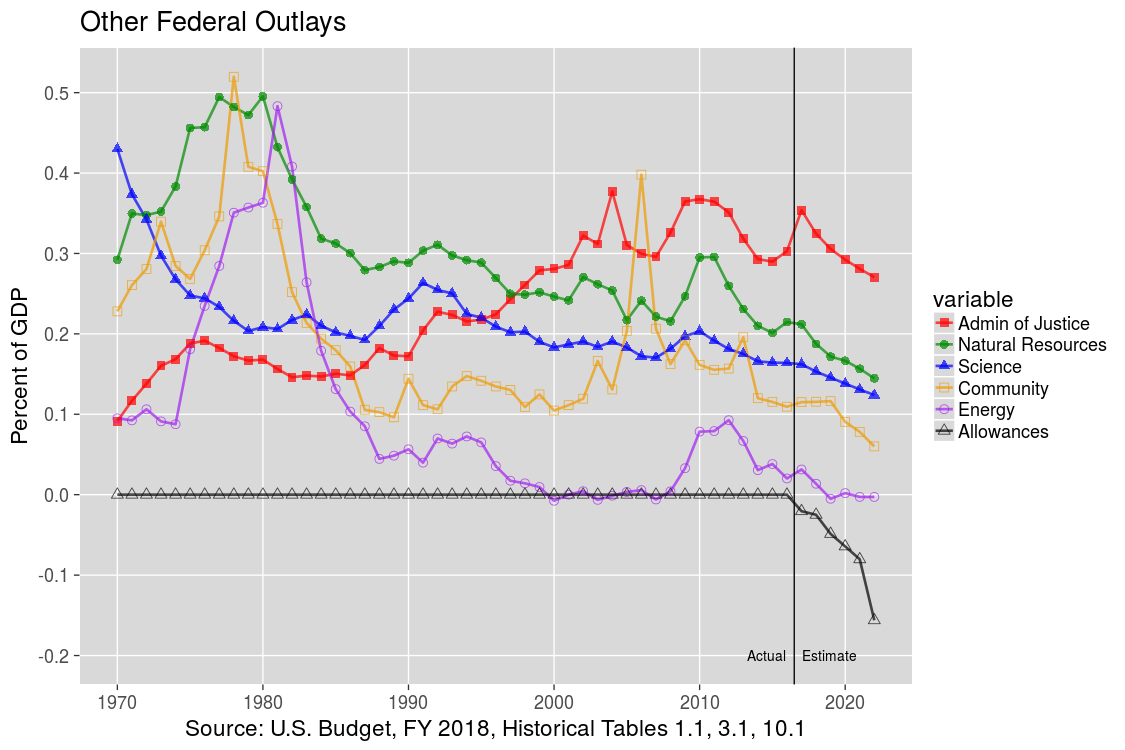
| 11‑12 | Outlays |
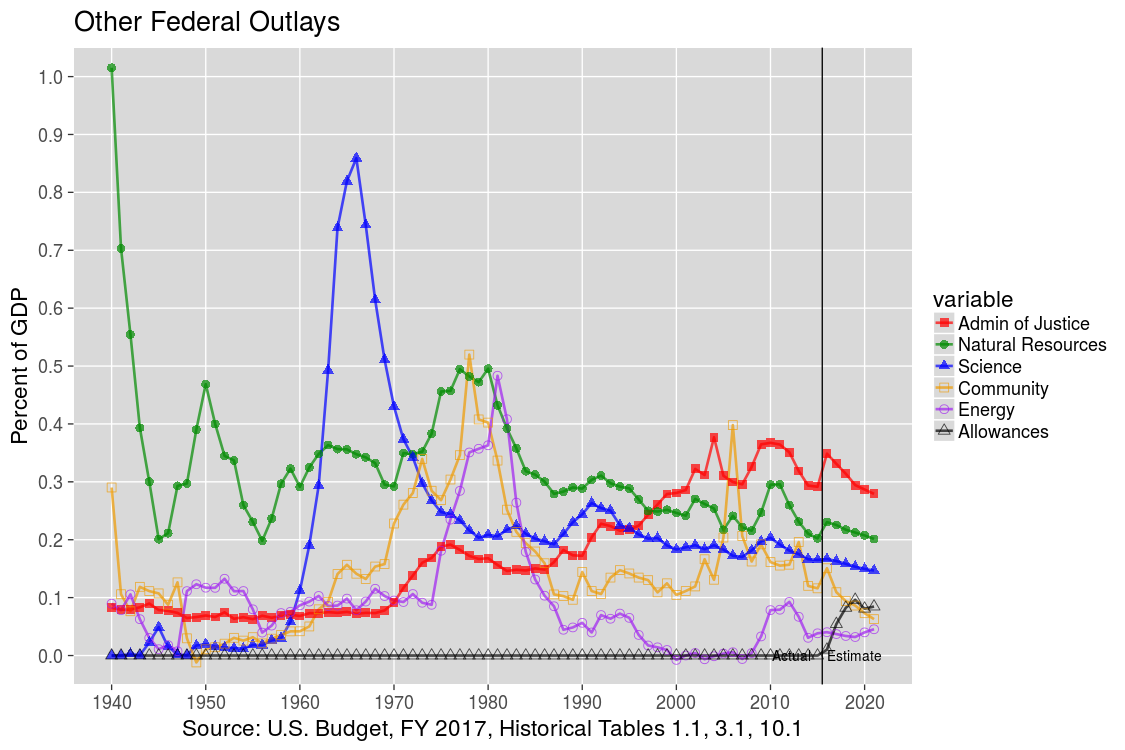
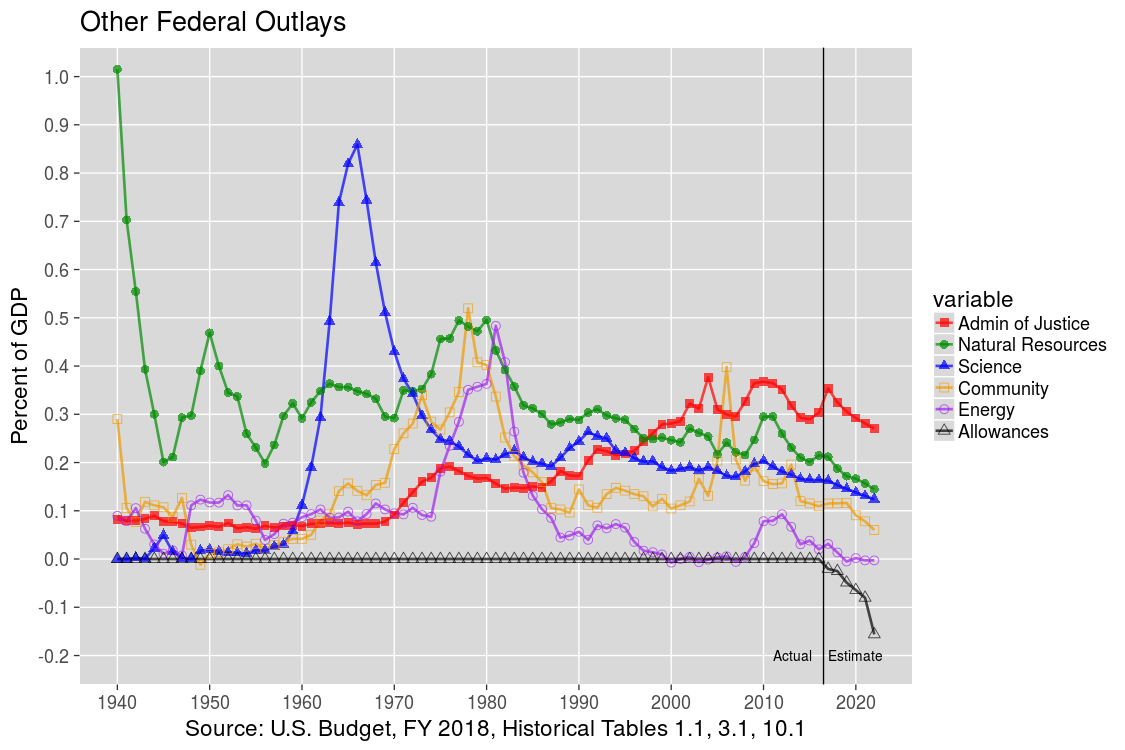
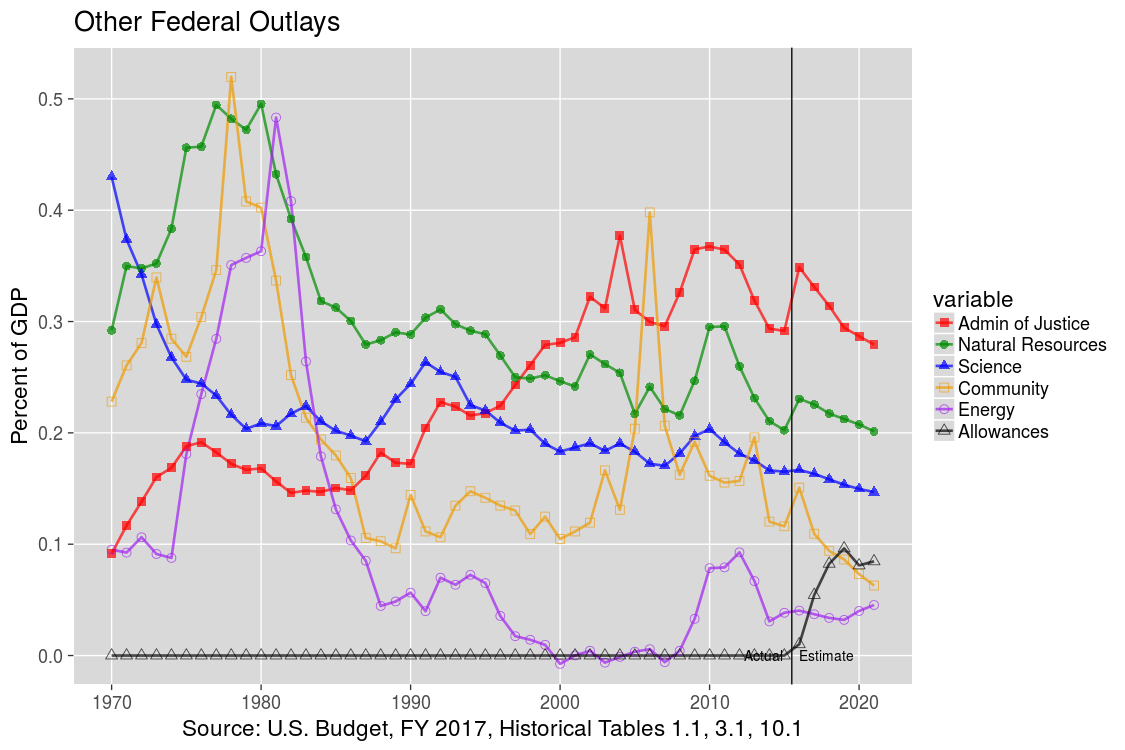
Trump projects decreases in outlays for Admin of Justice, Natural Resources, Science, and Community and projects that Energy outlays will drop to nearly zero (similar to 2000 to 2008 under Bush). Obama had projected smaller decreases. Also, Trump projects a sharp decrease in Allowances whereas Obama had projected an increase. |
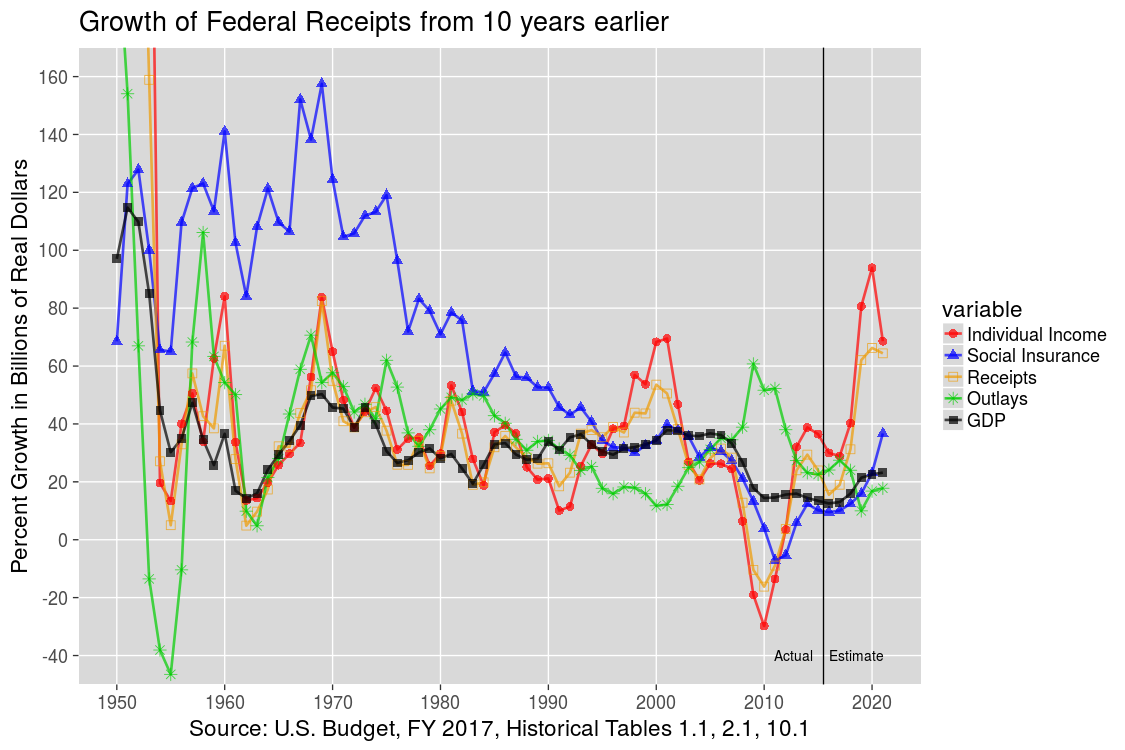
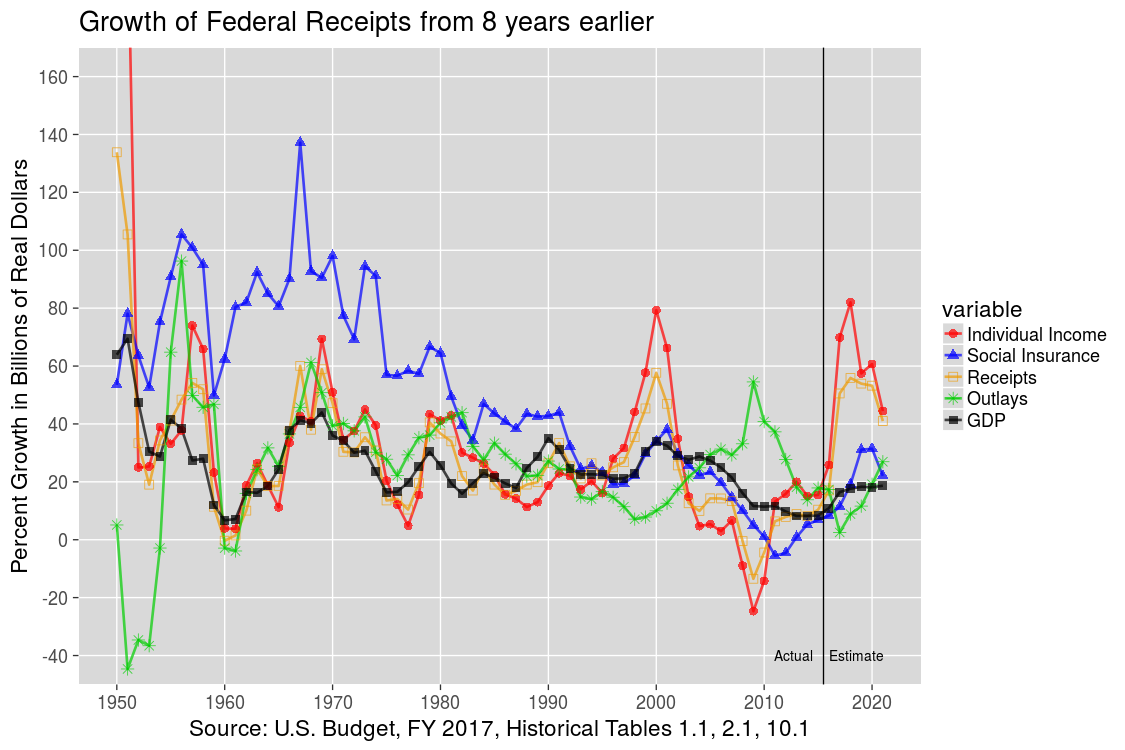
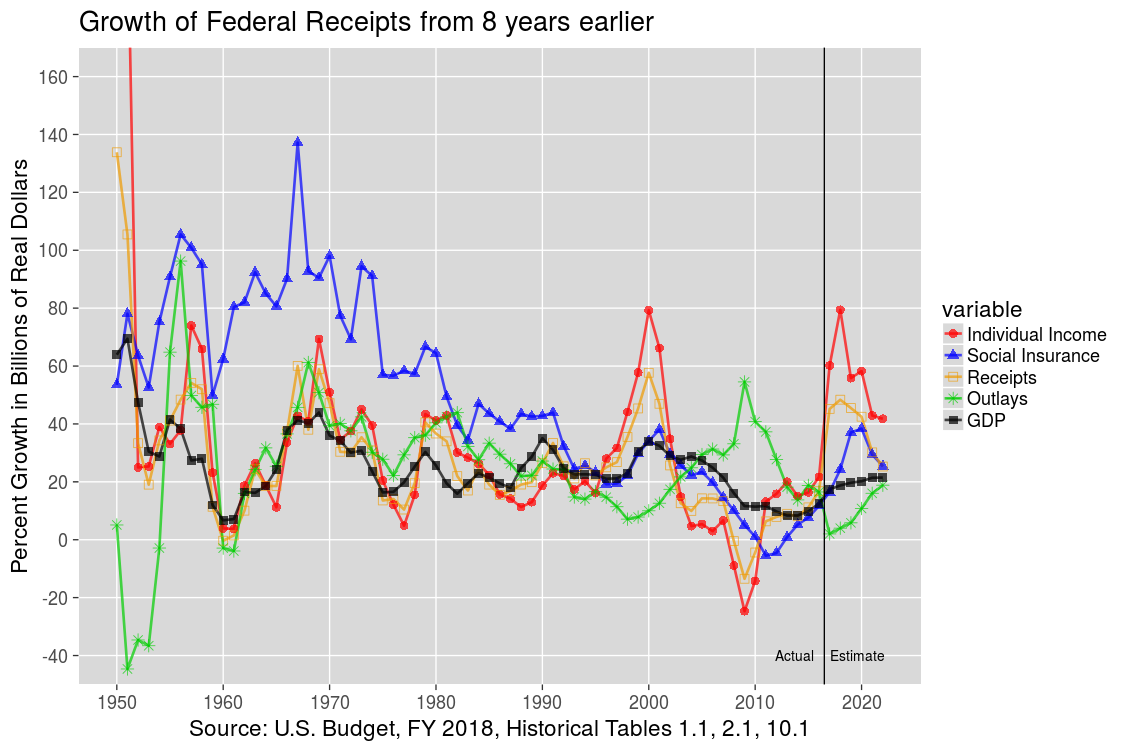
| 13‑14 | Growth |
Trump projects slower growth in total Receipts and Outlays but somewhat faster growth in Social Insurance receipts and GDP. |