Now let's see a graph of the Jimmy Carter recession in the early 80's.
Thanks for referencing my site. However, as pointed out in the related blog entry linked to at the bottom of this page, the job growth from 2000 to 2008 was the worst for any 8-year period since the Great Depression. Of course, it is better to measure over an entire business cycle. As the table at the bottom of this page shows, the annualized job growth from the trough of 1973 to the trough of 1983 was about 1.8 percent. However, the job growth from the peak of 2001 to the peak of 2008 was just 0.6 percent. Also, I just calculated that the job growth from the trough of 2003 to January of 2009 (which may not be the trough) is about 0.54 percent. Hence, even if you were to give Carter the full blame for the 80-82 recession, he achieved far better annualized job growth (1.8 percent) over a full business cycle than did George W. Bush (0.6 percent).
Any comments can be posted following the aforementioned blog entry or these related blog entries.
TOTAL NONFARM EMPLOYMENT AT END OF YEAR, SEASONALLY ADJUSTED, THOUSANDS
Year 0 1 2 3 4 5 6 7 8 9
---- ------ ------ ------ ------ ------ ------ ------ ------ ------ ------
1930 31539
1940 34172 38104 41915 42747 41861 39111 43379 44578 45028 43516
1950 46855 48308 50164 49702 49331 51805 52930 52385 52088 54175
1960 53743 54871 56027 57360 59420 62321 65199 66900 69245 71240
1970 70790 72108 75270 78035 77657 78017 80448 84408 88674 90669
1980 90936 90884 88756 92210 96087 98587 100484 103634 106871 108809
1990 109120 108263 109415 112206 116057 118207 121001 124358 127359 130532
2000 132485 130723 130183 130270 132351 134883 136982 138078 135489*
--------------------------------------------------------------------------
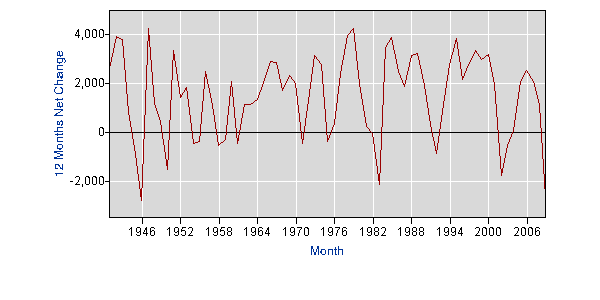
12 MONTHS NET CHANGE IN NONFARM EMPLOYMENT, SEASONALLY ADJUSTED, THOUSANDS
Year 0 1 2 3 4 5 6 7 8 9
---- ------ ------ ------ ------ ------ ------ ------ ------ ------ ------
1940 2633 3932 3811 832 -886 -2750 4268 1199 450 -1512
1950 3339 1453 1856 -462 -371 2474 1125 -545 -297 2087
1960 -432 1128 1156 1333 2060 2901 2878 1701 2345 1995
1970 -450 1318 3162 2765 -378 360 2431 3960 4266 1995
1980 267 -52 -2128 3454 3877 2500 1897 3150 3237 1938
1990 311 -857 1152 2791 3851 2150 2794 3357 3001 3173
2000 1953 -1762 -540 87 2081 2532 2099 1096 -2589*
--------------------------------------------------------------------------
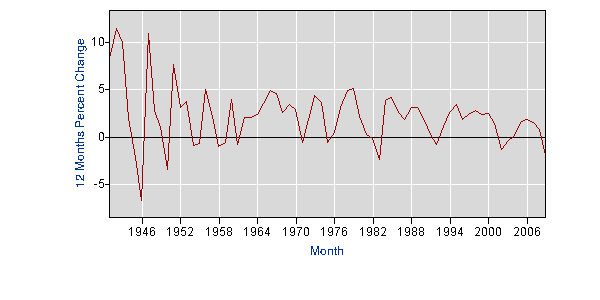
12 MONTHS PERCENT CHANGE IN TOTAL NONFARM EMPLOYMENT, SEASONALLY ADJUSTED
Year 0 1 2 3 4 5 6 7 8 9
---- ------ ------ ------ ------ ------ ------ ------ ------ ------ ------
1940 8.3 11.5 10.0 2.0 -2.1 -6.6 10.9 2.8 1.0 -3.4
1950 7.7 3.1 3.8 -0.9 -0.7 5.0 2.2 -1.0 -0.6 4.0
1960 -0.8 2.1 2.1 2.4 3.6 4.9 4.6 2.6 3.5 2.9
1970 -0.6 1.9 4.4 3.7 -0.5 0.5 3.1 4.9 5.1 2.2
1980 0.3 -0.1 -2.3 3.9 4.2 2.6 1.9 3.1 3.1 1.8
1990 0.3 -0.8 1.1 2.6 3.4 1.9 2.4 2.8 2.4 2.5
2000 1.5 -1.3 -0.4 0.1 1.6 1.9 1.6 0.8 -1.9*
--------------------------------------------------------------------------
8 YEARS PERCENT CHANGE IN TOTAL NONFARM EMPLOYMENT, SEASONALLY ADJUSTED
End
Year 0 1 2 3 4 5 6 7 8 9
---- ------ ------ ------ ------ ------ ------ ------ ------ ------ ------
1940 41.3 31.8 14.2
1950 11.8 13.0 19.8 27.1 13.7 16.2 17.5 20.4 11.2 12.1
1960 7.1 10.4 13.6 10.7 12.3 19.0 25.2 23.5 28.8 29.8
1970 26.3 25.7 26.7 25.2 19.1 16.6 16.2 18.5 25.3 25.7
1980 20.8 16.5 14.3 18.2 19.4 16.8 13.3 14.3 17.5 19.7
1990 22.9 17.4 13.9 13.8 15.5 14.1 13.2 14.3 16.7 20.6
2000 21.1 16.5 12.2 10.2 9.4 8.5 7.6 5.8 2.3*
* preliminary
Source: Employment, Hours, and Earnings from the Current Employment Statistics survey,
Total Nonfarm Employment - Seasonally Adjusted - CES0000000001