FAMILY NET WORTH, BY SELECTED CHARACTERISTICS OF FAMILIES, 1989-2004 SURVEYS (thousands of 2004 dollars)
Median Mean
---------------------------------------------- ----------------------------------------------
Family characteristic 1989 1992 1995 1998 2001 2004 1989 1992 1995 1998 2001 2004
------------------------- ------ ------ ------ ------ ------ ------ ------ ------ ------ ------ ------ ------
All Families 68.8 65.2 70.8 83.1 92.2 93.1 272.6 245.7 260.8 327.5 422.9 448.2
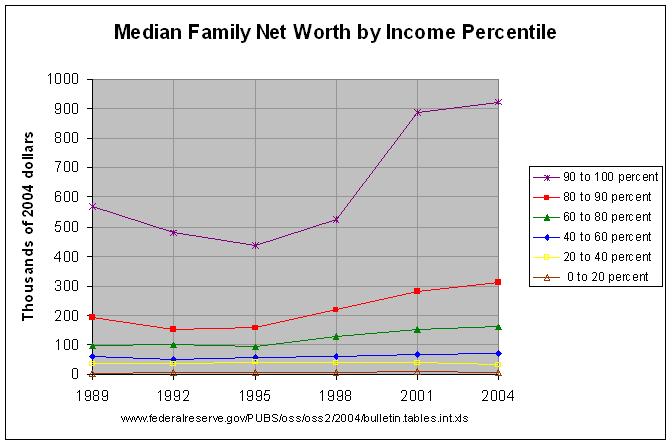
Percentiles of income
Less than 20 2.6 5.2 7.4 6.8 8.4 7.5 36.2 43.4 54.7 55.4 56.2 72.6
20-39.9 35.3 36.6 41.3 38.4 39.9 33.7 96.4 84.6 97.4 111.4 122.7 121.5
40-59.9 61.1 52.1 57.1 61.9 67.8 72.0 148.5 133.3 126.0 146.6 173.3 194.6
60-79.9 97.5 99.3 93.6 130.2 152.6 160.0 199.3 185.4 198.5 238.3 313.2 340.8
80-89.9 193.5 151.8 157.7 218.5 280.3 313.3 326.1 297.1 316.8 377.1 487.0 487.4
90-100 569.5 479.3 436.9 524.4 887.9 924.1 1438.5 1266.0 1338.0 1793.9 2410.9 2534.6
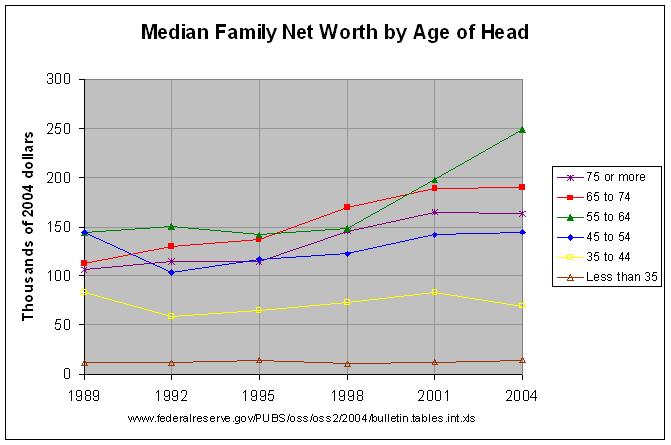
Age of head (years)
Less than 35 11.4 12.0 14.8 10.6 12.5 14.2 68.7 59.7 53.2 74.0 96.6 73.5
35-44 82.7 58.7 64.2 73.5 82.6 69.4 216.4 175.5 176.8 227.6 276.6 299.2
45-54 144.8 103.1 116.8 122.5 141.6 144.7 405.1 353.3 364.8 420.2 517.6 542.7
55-64 143.5 150.2 141.9 148.2 197.4 248.7 451.2 445.4 471.0 617.0 779.5 843.8
65-74 112.4 130.0 136.6 169.8 189.4 190.1 410.2 377.6 429.3 541.1 722.6 690.9
75 or more 106.2 114.5 114.5 145.6 165.4 163.1 354.2 282.3 317.9 360.3 499.6 528.1
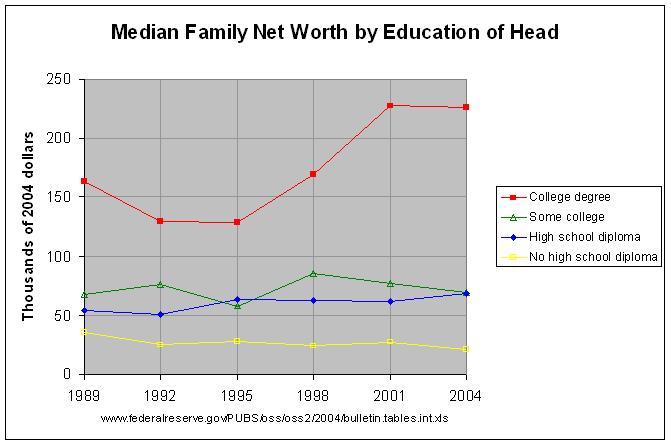
Education of head
No high school diploma 35.3 24.6 27.9 24.5 27.2 20.6 121.8 92.4 103.7 91.4 110.8 136.5
High school diploma 54.0 50.7 63.9 62.7 61.8 68.7 163.3 147.1 163.7 182.9 193.0 196.8
Some college 67.4 76.0 57.6 85.6 77.5 69.3 273.3 226.0 232.3 275.5 305.7 308.6
College degree 162.8 129.4 128.6 169.7 227.2 226.1 530.2 447.5 473.6 612.3 848.0 851.3
Race or ethnicity of respondent
White non-Hispanic 104.2 91.9 94.3 111.0 130.2 140.7 333.4 292.9 308.7 391.1 520.2 561.8
Nonwhite or Hispanic 9.8 15.8 19.5 19.3 19.1 24.8 92.1 102.0 94.9 116.5 125.1 153.1
Current work status of head
Working for someone else 55.7 51.6 60.3 61.2 69.3 67.2 166.7 161.0 168.4 194.8 240.3 268.5
Self-employed 248.7 190.2 191.8 288.0 375.2 335.6 955.2 790.6 862.7 1071.3 1342.9 1423.2
Retired 96.9 92.9 99.9 131.0 123.1 139.8 267.9 250.1 277.2 356.5 483.6 469.0
Other not working 1.2 4.3 4.5 4.1 9.5 11.8 57.6 70.0 70.1 85.8 192.3 162.3
Region
Northeast 128.1 84.5 102.0 109.3 99.3 161.7 316.1 277.2 308.9 351.3 483.2 569.1
Midwest 77.0 75.1 80.8 93.1 113.3 115.0 274.8 228.1 244.7 288.5 363.3 436.1
South 51.7 45.5 54.2 71.0 78.6 63.8 192.8 185.5 229.5 309.6 400.6 348.0
West 67.2 94.2 67.4 71.1 93.4 94.8 360.0 335.4 286.1 379.1 470.4 523.7
Housing status
Owner 147.1 130.2 128.1 153.2 183.8 184.4 394.8 355.7 373.7 468.7 596.9 624.9
Renter or other 2.9 4.2 6.0 4.9 5.1 4.0 56.3 50.9 53.8 50.4 58.6 54.1
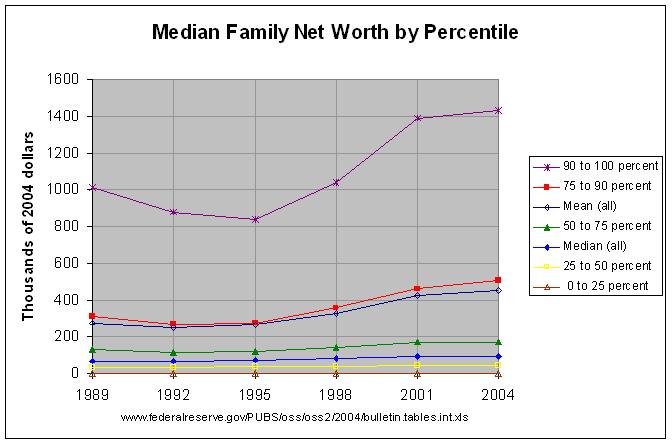
Percentiles of net worth
Less than 25 0.3 0.6 1.2 0.6 1.2 1.7 -0.9 -0.8 -0.2 -2.1 0.0 -1.4
25-49.9 30.9 30.9 34.7 37.9 43.5 43.6 33.7 33.4 37.6 41.6 47.2 47.1
50-74.9 127.0 115.4 117.1 139.7 168.2 170.7 130.4 119.2 122.6 149.1 177.9 185.4
75-89.9 308.2 268.5 272.3 357.7 458.8 506.8 331.2 287.4 293.6 372.7 480.7 526.7
90-100 1009.5 876.2 836.7 1039.1 1388.5 1430.1 1820.7 1645.8 1766.7 2244.2 2944.3 3114.2
---------------------------------------------------------------------------------------------------------------------------
Source: 2004 Survey of Consumer Finances, Internal Data, Table 3
Note: Data from the 2007 Survey of Consumer Finances is expected to be released in the first quarter of 2009.