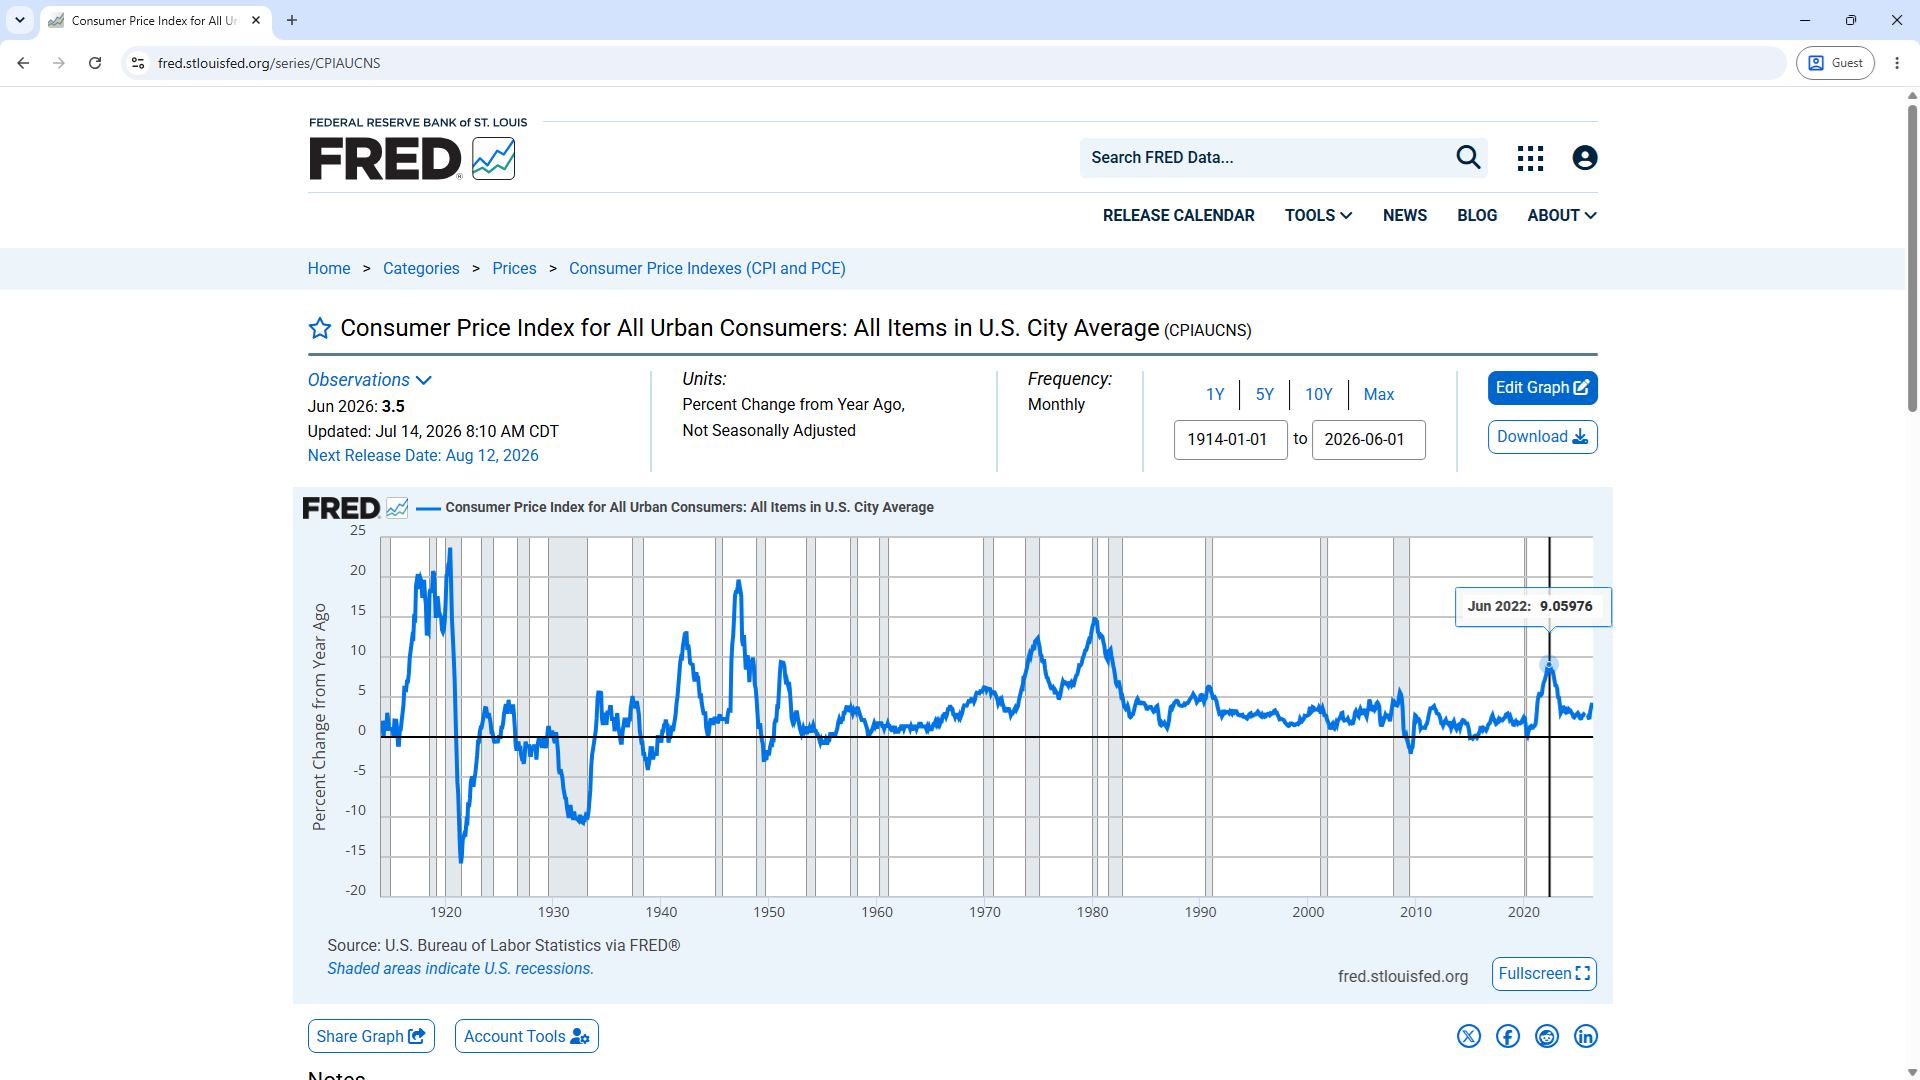
Note: Directions for creating this graph can be found at the end of the section titled Analyzing CPI and M2 Money Supply with Online Tools of the Federal Reserve below. The one difference is that the graph above was created with a width of 1400 instead of the 1200 described below.
Real GDP (percent change from year ago), 1948 to Present
Real GDP (annualized rate of change), 1948 to Present, 1948 to Present
The above two graphs were created via the following steps:
Analyzing CPI and M2 Money Supply with Online Tools of the Federal Reserve
The percent change in the Consumer Price Index (CPI), including the recent high of 9 percent in 2022, can be seen via the following steps:
In addition, you can click the "Share Graph" button beneath the graph to share a link to a non-interactive image of the graph, a link to an interactive version of the graph, or the code to embed an interactive version of the graph into a web page. In all three cases, you can choose 1) Always chart from 1914-01-01 to the last value available, 2) Always chart the last 112 years 5 months of data available, or 3)Always chart from 1914-01-01 to 2026-06-01. The code to embed the first version of the graph was added below:
Since the first version of the graph will "chart from 1914-01-01 to the last value available", this second graph will continue to be updated over time whereas the graph before it, being static, will not.
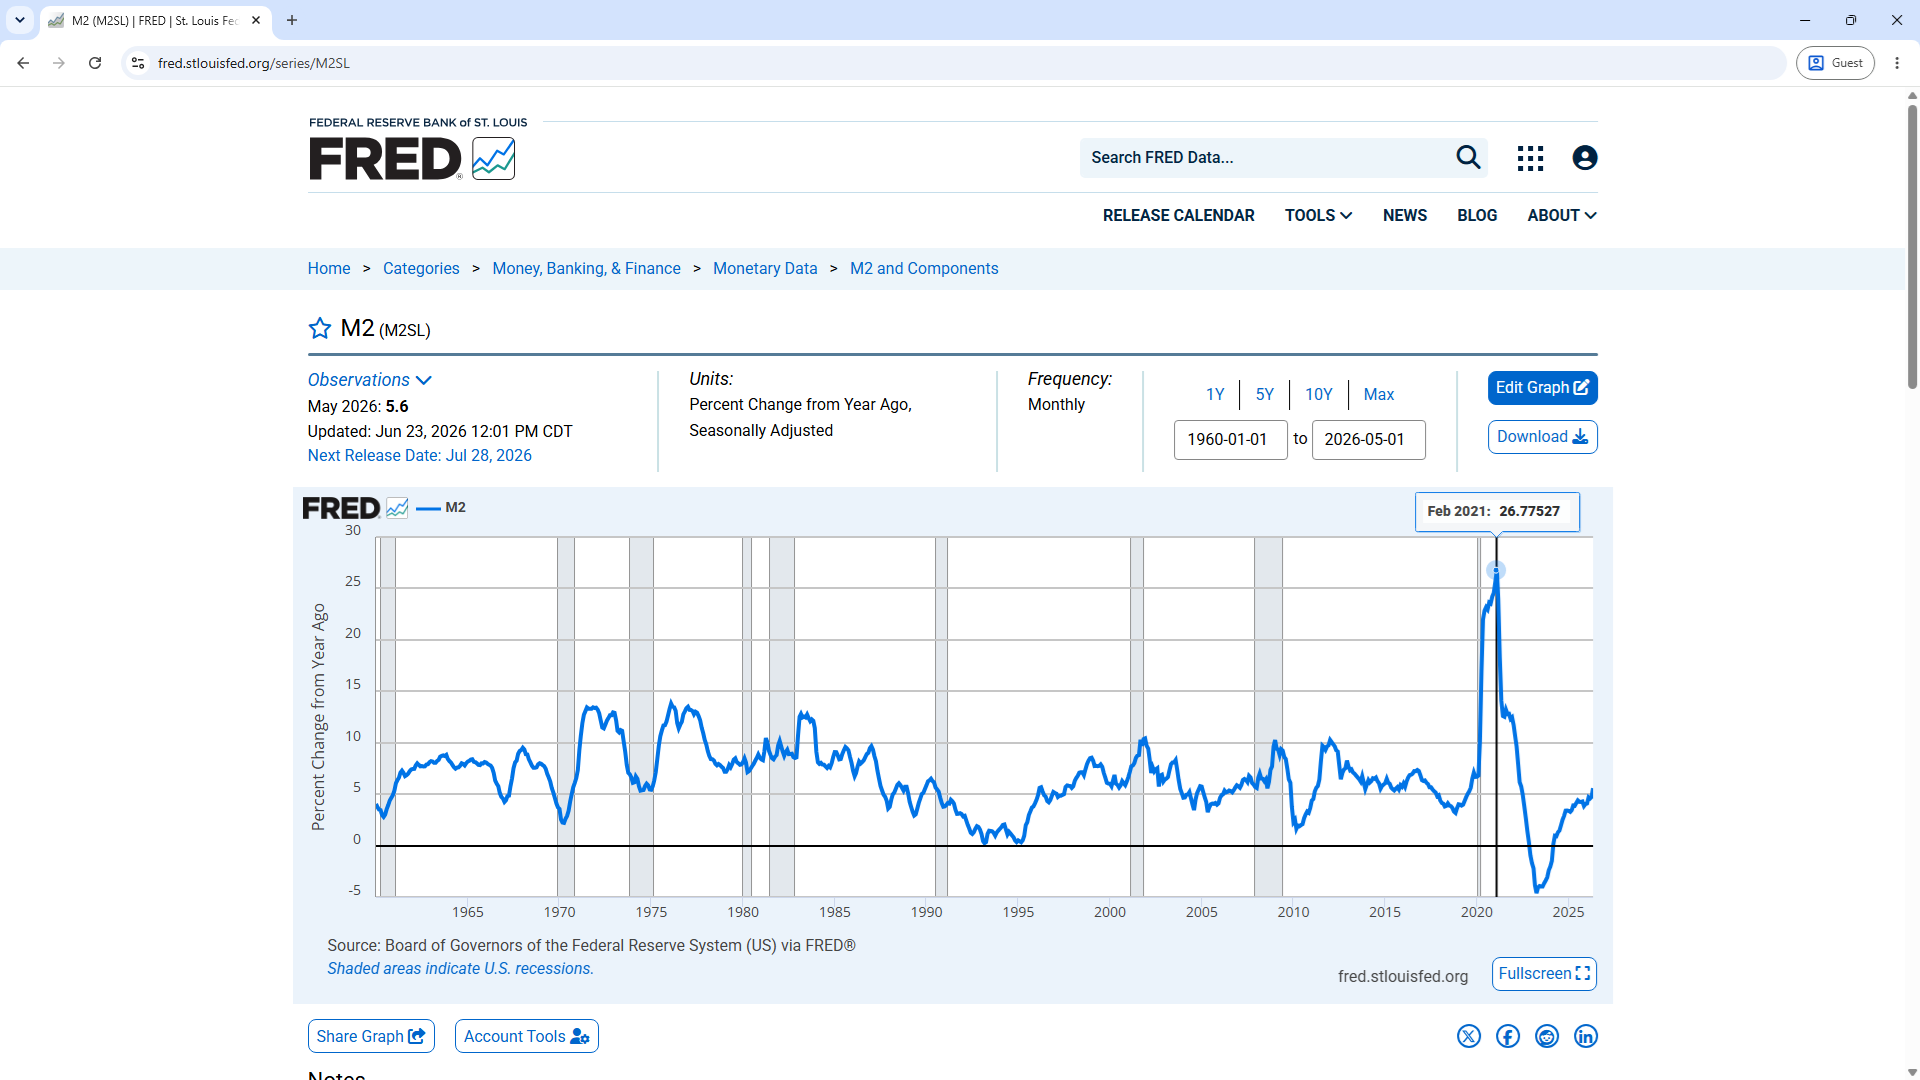
The percent change in the M2 money supply, including a recent high of over 26 percent in 2022, can be seen via the following steps:
The percent change in the Consumer Price Index (CPI) can now be added to this graph via the following additional steps:
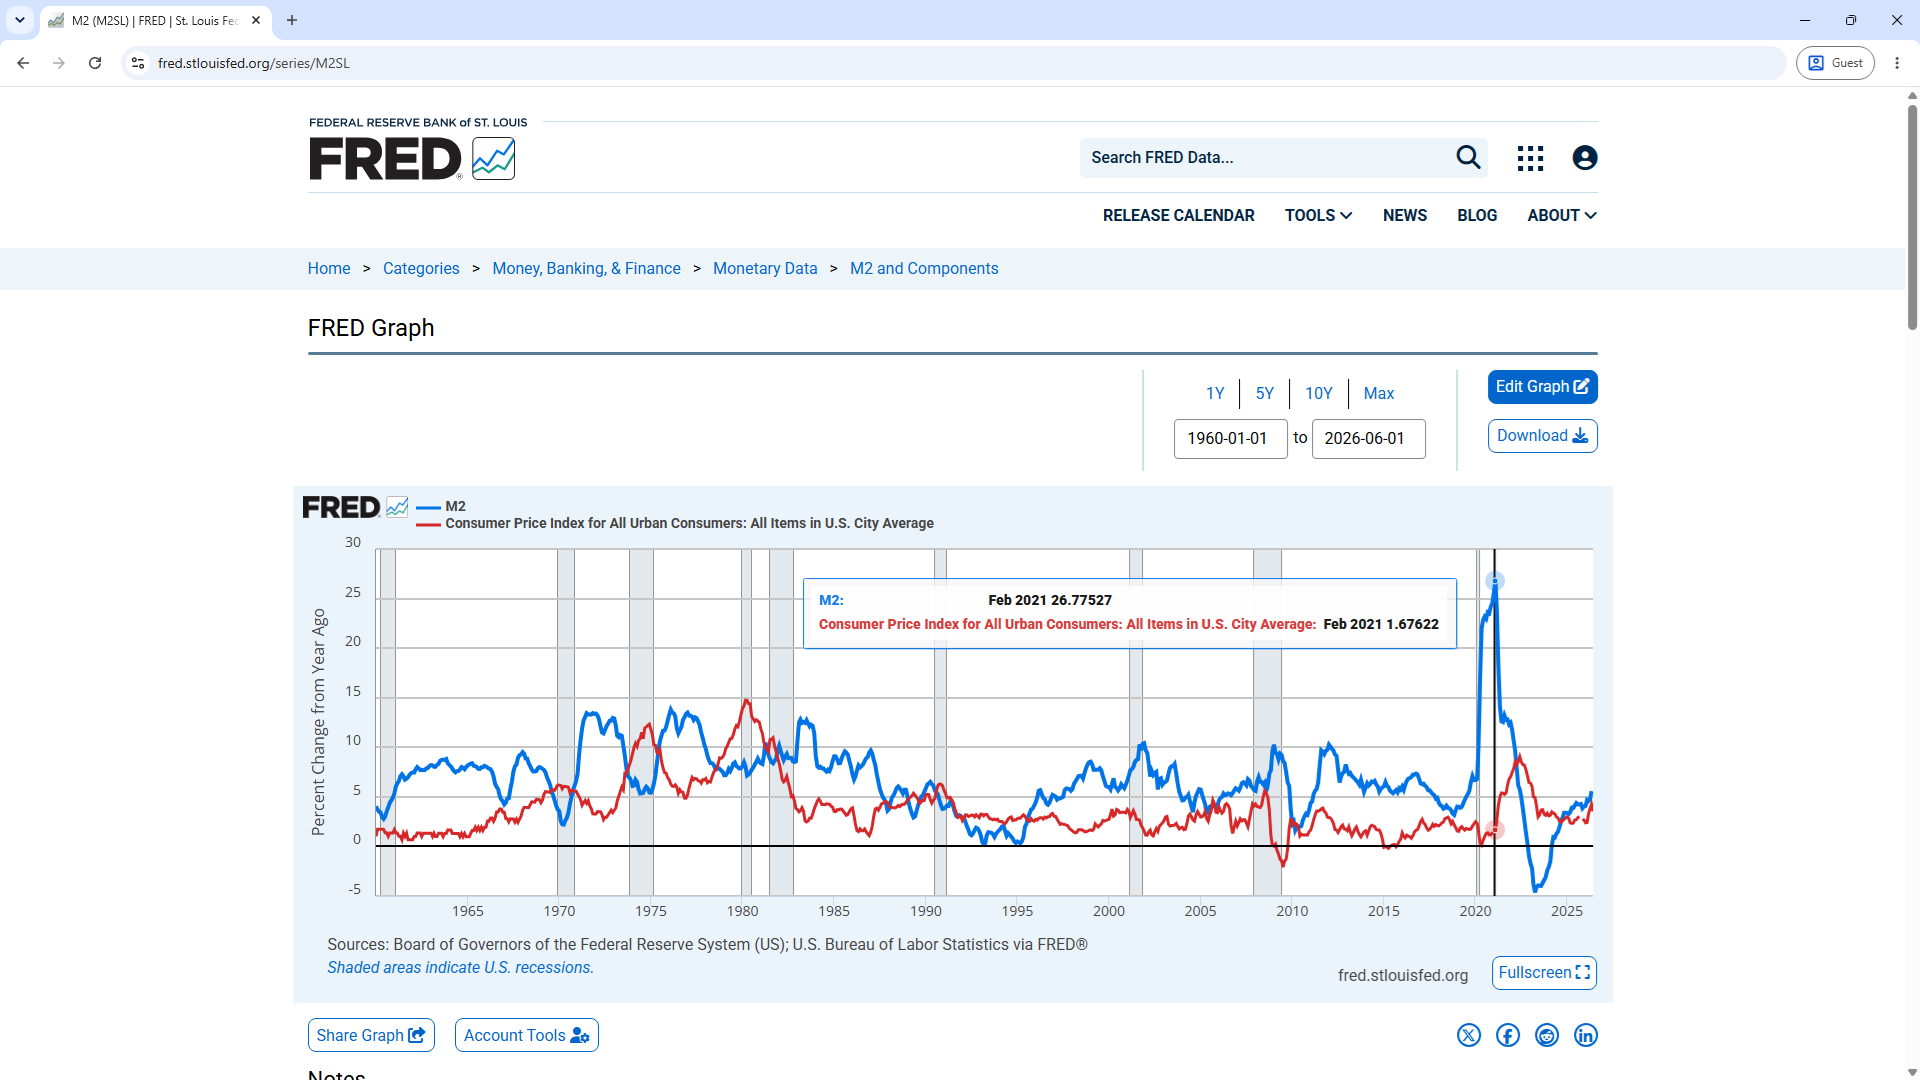
As before, you can click the "Share Graph" button beneath the graph and generate the code to embed an interactive version of the graph into a web page. Also as before, you can choose the first option to "Always chart from 1914-01-01 to the last value available". This will generate a graph similar in size to the relatively small one above. However, the height and width can be changed to make it larger. To generate the graph below, the widths of 670 and 670px were expanded to 1200 and 1200px. Also, the heights of 475 and 525px were changed to 650 and 700px.
Spotting Misleading Arguments with Online Tools of the Federal Reserve
The online tools of the Federal Reserve can also be used to spot misleading arguments. For example, the following excerpt is from a transcript of a Jake Tapper interview of National Economic Council Director Kevin Hassett on August 9, 2026:
TAPPER: Yes, it's 800,000, according to you, versus two million under Biden.
And I think the issue is that there are two things right now that the economists say are weighing on the economy. Both of them are specifically Trump policies. One is obviously the Iran war, which has led to high gas prices. The president said that that war would take four to six weeks. We're now in month six.
And the second policy that's having an impact is tariffs, which, according to a recent report by the Fed, those tariffs were passed on to customers, consumers, in the form of higher prices. So it does seem as though the president's policies have led to this economic situation where the job growth is slower than in the last 18 months of Biden's administration.
HASSETT: Well, let's unpack these things.
First of all, if you look at the latest inflation numbers, right, the Consumer Price Index was negative for the month of June. Core was zero. That's the thing that the Fed cares about. The PCE index, which is the Fed's number one index, was negative both for core and top line.
And so all of the price data have been decelerating. Now, there was a big inflation in the previous administration, but there's been rapid deceleration of inflation under President Trump. And so, if you're going to tell a story that tariffs are causing some kind of positive shock to inflation, then you got to come up with some counterfactual that explains why it is that right now inflation is running at about zero.
At first, Kevin Hassett's claim that "the Consumer Price Index was negative for the month of June" seems to contradict the prior graph. The trick is that Hassett is referring to the CPI of a single month whereas the prior graph is showing the percent change from a year ago. At the time of the interview, that number was about 3.5 percent. The measurement that Hassett is referring to can be added to the prior graph via the following steps:
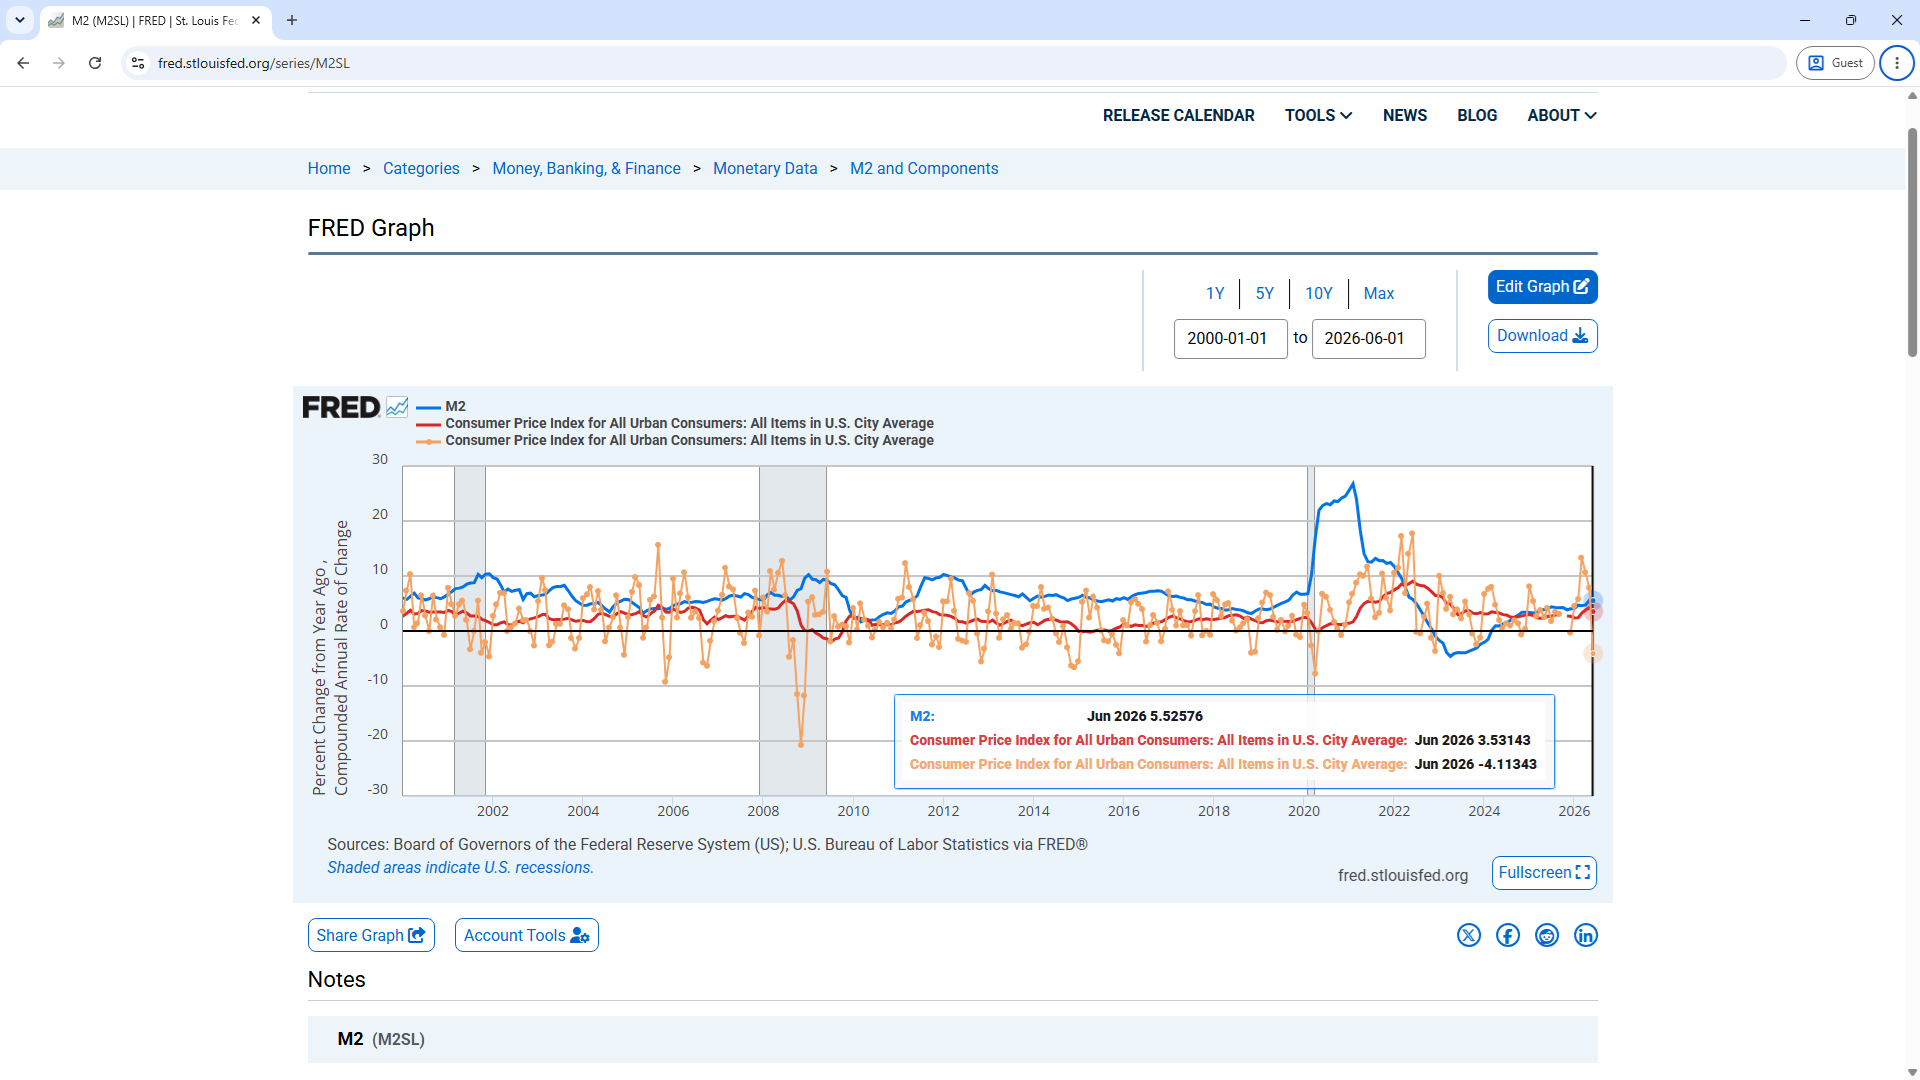
Note the 3 orange dots preceding the orange dot showing -4.1 percent for June 2026. Those dots show compounded annual rates of change of about 13.3, 10.7, and 7.8 percent for March, April, and May of 2026. Of course, Hassett doesn't mention this since it would show the misleading nature of his argument that "right now inflation is running at about zero".
Also, note in the graphs above how the the annual growth in the M2 money supply was already very high in January of 2021, the last month of Trump's first term as President. The annual growth reached its peak just a month later, in February of 2021. This growth in M2 likely had much to do with the growth in inflation which peaked in June of 2022 at about 9 percent, just 5 months after Trump left office. Hence, it seems misleading to blame the inflation only on Biden when many of the conditions that led to it were likely already in place when he took office.
Analyzing CPI and M2 Money Supply with Data from Other Sources
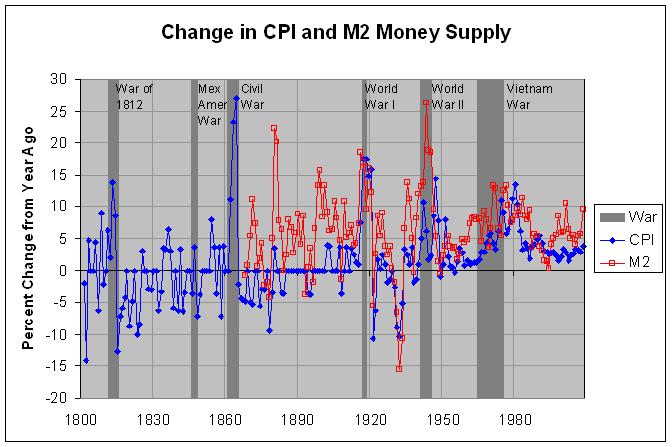
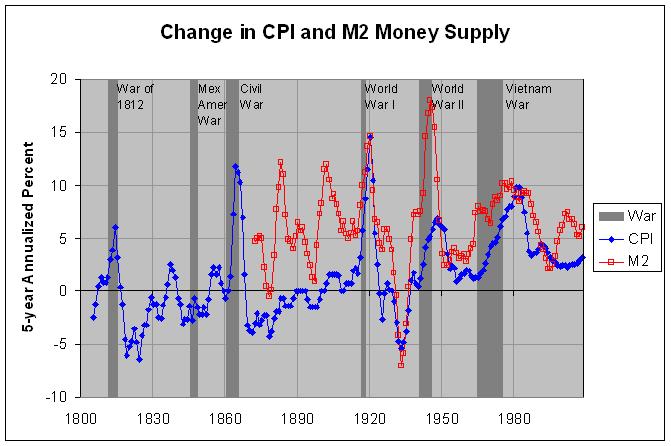
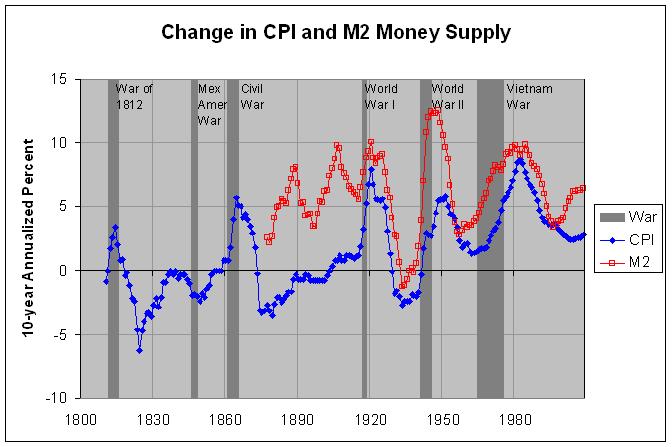
CONSUMER PRICE INDEX AND M2 MONEY SUPPLY: 1800-2008
(M2 in billions of dollars)
CPI 5-year 10-Year M2 M2SL 5-year 10-year
(1967 Percent Annual- Annual- Money Percent (from Percent Annual- Annual-
Year =100) Change ized ized Supply Change Fed) Change ized ized War Year
---- ------- ------- ------- ------- ------- ------- ------- ------- ------- ------- --- ----
1800 51.0 0 1800
1801 50.0 -1.96 0 1801
1802 43.0 -14.00 0 1802
1803 45.0 4.65 0 1803
1804 45.0 0.00 0 1804
1805 45.0 0.00 -2.47 0 1805
1806 47.0 4.44 -1.23 0 1806
1807 44.0 -6.38 0.46 0 1807
1808 48.0 9.09 1.30 0 1808
1809 47.0 -2.08 0.87 0 1809
1810 47.0 0.00 0.87 -0.81 0 1810
1811 50.0 6.38 1.25 0.00 0 1811
1812 51.0 2.00 3.00 1.72 1 1812
1813 58.0 13.73 3.86 2.57 1 1813
1814 63.0 8.62 6.03 3.42 1 1814
1815 55.0 -12.70 3.19 2.03 1 1815
1816 51.0 -7.27 0.40 0.82 0 1816
1817 48.0 -5.88 -1.21 0.87 0 1817
1818 46.0 -4.17 -4.53 -0.42 0 1818
1819 46.0 0.00 -6.10 -0.21 0 1819
1820 42.0 -8.70 -5.25 -1.12 0 1820
1821 40.0 -4.76 -4.74 -2.21 0 1821
1822 40.0 0.00 -3.58 -2.40 0 1822
1823 36.0 -10.00 -4.78 -4.66 0 1823
1824 33.0 -8.33 -6.43 -6.26 0 1824
1825 34.0 3.03 -4.14 -4.70 0 1825
1826 34.0 0.00 -3.20 -3.97 0 1826
1827 34.0 0.00 -3.20 -3.39 0 1827
1828 33.0 -2.94 -1.73 -3.27 0 1828
1829 32.0 -3.03 -0.61 -3.56 0 1829
1830 32.0 0.00 -1.21 -2.68 0 1830
1831 32.0 0.00 -1.21 -2.21 0 1831
1832 30.0 -6.25 -2.47 -2.84 0 1832
1833 29.0 -3.33 -2.55 -2.14 0 1833
1834 30.0 3.45 -1.28 -0.95 0 1834
1835 31.0 3.33 -0.63 -0.92 0 1835
1836 33.0 6.45 0.62 -0.30 0 1836
1837 34.0 3.03 2.53 0.00 0 1837
1838 32.0 -5.88 1.99 -0.31 0 1838
1839 32.0 0.00 1.30 0.00 0 1839
1840 30.0 -6.25 -0.65 -0.64 0 1840
1841 31.0 3.33 -1.24 -0.32 0 1841
1842 29.0 -6.45 -3.13 -0.34 0 1842
1843 28.0 -3.45 -2.64 -0.35 0 1843
1844 28.0 0.00 -2.64 -0.69 0 1844
1845 28.0 0.00 -1.37 -1.01 0 1845
1846 27.0 -3.57 -2.73 -1.99 1 1846
1847 28.0 3.70 -0.70 -1.92 1 1847
1848 26.0 -7.14 -1.47 -2.05 1 1848
1849 25.0 -3.85 -2.24 -2.44 0 1849
1850 25.0 0.00 -2.24 -1.81 0 1850
1851 25.0 0.00 -1.53 -2.13 0 1851
1852 25.0 0.00 -2.24 -1.47 0 1852
1853 25.0 0.00 -0.78 -1.13 0 1853
1854 27.0 8.00 1.55 -0.36 0 1854
1855 28.0 3.70 2.29 0.00 0 1855
1856 27.0 -3.57 1.55 0.00 0 1856
1857 28.0 3.70 2.29 0.00 0 1857
1858 26.0 -7.14 0.79 0.00 0 1858
1859 27.0 3.85 0.00 0.77 0 1859
1860 27.0 0.00 -0.72 0.77 0 1860
1861 27.0 0.00 0.00 0.77 1 1861
1862 30.0 11.11 1.39 1.84 1 1862
1863 37.0 23.33 7.31 4.00 1 1863
1864 47.0 27.03 11.72 5.70 1 1864
1865 46.0 -2.13 11.24 5.09 1 1865
1866 44.0 -4.35 10.26 5.00 0 1866
1867 42.0 -4.55 6.96 4.14 1.28 0 1867
1868 40.0 -4.76 1.57 4.40 1.27 -0.78 0 1868
1869 40.0 0.00 -3.17 4.01 1.28 0.79 0 1869
1870 38.0 -5.00 -3.75 3.48 1.35 5.47 0 1870
1871 36.0 -5.26 -3.93 2.92 1.50 11.11 0 1871
1872 36.0 0.00 -3.04 1.84 1.61 7.33 4.69 0 1872
1873 36.0 0.00 -2.09 -0.27 1.62 0.62 4.99 0 1873
1874 34.0 -5.56 -3.20 -3.19 1.65 1.85 5.21 0 1874
1875 33.0 -2.94 -2.78 -3.27 1.72 4.24 4.96 0 1875
1876 32.0 -3.03 -2.33 -3.13 1.68 -2.33 2.29 0 1876
1877 32.0 0.00 -2.33 -2.68 1.65 -1.79 0.49 2.57 0 1877
1878 29.0 -9.38 -4.23 -3.16 1.58 -4.24 -0.50 2.21 0 1878
1879 28.0 -3.45 -3.81 -3.50 1.66 5.06 0.12 2.63 0 1879
1880 29.0 3.57 -2.55 -2.67 2.03 22.29 3.37 4.16 0 1880
1881 29.0 0.00 -1.95 -2.14 2.44 20.20 7.75 4.99 0 1881
1882 29.0 0.00 -1.95 -2.14 2.63 7.79 9.77 5.03 0 1882
1883 28.0 -3.45 -0.70 -2.48 2.80 6.46 12.12 5.62 0 1883
1884 27.0 -3.57 -0.72 -2.28 2.80 0.00 11.02 5.43 0 1884
1885 27.0 0.00 -1.42 -1.99 2.87 2.50 7.17 5.25 0 1885
1886 27.0 0.00 -1.42 -1.68 3.10 8.01 4.90 6.32 0 1886
1887 27.0 0.00 -1.42 -1.68 3.31 6.77 4.71 7.21 0 1887
1888 27.0 0.00 -0.72 -0.71 3.40 2.72 3.96 7.96 0 1888
1889 27.0 0.00 0.00 -0.36 3.60 5.88 5.15 8.05 0 1889
1890 27.0 0.00 0.00 -0.71 3.92 8.89 6.43 6.80 0 1890
1891 27.0 0.00 0.00 -0.71 4.08 4.08 5.65 5.28 0 1891
1892 27.0 0.00 0.00 -0.71 4.43 8.58 6.00 5.35 0 1892
1893 27.0 0.00 0.00 -0.36 4.26 -3.84 4.61 4.29 0 1893
1894 26.0 -3.70 -0.75 -0.38 4.28 0.47 3.52 4.33 0 1894
1895 25.0 -3.85 -1.53 -0.77 4.43 3.50 2.48 4.44 0 1895
1896 25.0 0.00 -1.53 -0.77 4.35 -1.81 1.29 3.45 0 1896
1897 25.0 0.00 -1.53 -0.77 4.64 6.67 0.93 3.44 0 1897
1898 25.0 0.00 -1.53 -0.77 5.26 13.36 4.31 4.46 0 1898
1899 25.0 0.00 -0.78 -0.77 6.09 15.78 7.31 5.40 0 1899
1900 25.0 0.00 0.00 -0.77 6.60 8.37 8.30 5.35 0 1900
1901 25.0 0.00 0.00 -0.77 7.48 13.33 11.45 6.25 0 1901
1902 26.0 4.00 0.79 -0.38 8.17 9.22 11.98 6.31 0 1902
1903 27.0 3.85 1.55 0.00 8.68 6.24 10.54 7.38 0 1903
1904 27.0 0.00 1.55 0.38 9.24 6.45 8.70 8.00 0 1904
1905 27.0 0.00 1.55 0.77 10.24 10.82 9.18 8.74 0 1905
1906 27.0 0.00 1.55 0.77 11.08 8.20 8.18 9.80 0 1906
1907 28.0 3.70 1.49 1.14 11.60 4.69 7.26 9.60 0 1907
1908 27.0 -3.57 0.00 0.77 11.44 -1.38 5.68 8.08 0 1908
1909 27.0 0.00 0.00 0.77 12.68 10.84 6.53 7.61 0 1909
1910 28.0 3.70 0.73 1.14 13.34 5.21 5.43 7.29 0 1910
1911 28.0 0.00 0.73 1.14 14.12 5.85 4.97 6.56 0 1911
1912 29.0 3.57 0.70 1.10 15.13 7.15 5.46 6.36 0 1912
1913 29.7 2.41 1.92 0.96 15.73 3.97 6.58 6.13 0 1913
1914 30.1 1.35 2.20 1.09 16.39 4.20 5.27 5.90 0 1914
1915 30.4 1.00 1.66 1.19 17.59 7.32 5.69 5.56 0 1915
1916 32.7 7.57 3.15 1.93 20.85 18.53 8.11 6.53 0 1916
1917 38.4 17.43 5.78 3.21 24.37 16.88 10.00 7.71 1 1917
1918 45.1 17.45 8.71 5.26 26.73 9.68 11.19 8.86 1 1918
1919 51.8 14.86 11.47 6.73 31.01 16.01 13.60 9.35 0 1919
1920 60.0 15.83 14.57 7.92 34.80 12.22 14.62 10.06 0 1920
1921 53.6 -10.67 10.39 6.71 32.85 -5.60 9.52 8.81 0 1921
1922 50.2 -6.34 5.51 5.64 33.72 2.65 6.71 8.34 0 1922
1923 51.1 1.79 2.53 5.58 36.60 8.54 6.49 8.81 0 1923
1924 51.2 0.20 -0.23 5.46 38.58 5.41 4.47 8.94 0 1924
1925 52.5 2.54 -2.64 5.62 42.05 8.99 3.86 9.11 0 1925
1926 53.0 0.95 -0.22 4.95 43.68 3.88 5.86 7.68 0 1926
1927 52.0 -1.89 0.71 3.08 44.73 2.40 5.81 6.26 0 1927
1928 51.3 -1.35 0.08 1.30 46.42 3.78 4.87 5.67 0 1928
1929 51.3 0.00 0.04 -0.10 46.60 0.39 3.85 4.16 0 1929
1930 50.0 -2.53 -0.97 -1.81 45.73 -1.87 1.69 2.77 0 1930
1931 45.6 -8.80 -2.96 -1.60 42.69 -6.65 -0.46 2.65 0 1931
1932 40.9 -10.31 -4.69 -2.03 36.05 -15.55 -4.22 0.67 0 1932
1933 38.8 -5.13 -5.43 -2.72 32.22 -10.62 -7.04 -1.27 0 1933
1934 40.1 3.35 -4.81 -2.41 34.36 6.64 -5.91 -1.15 0 1934
1935 41.1 2.49 -3.84 -2.42 39.07 13.71 -3.10 -0.73 0 1935
1936 41.5 0.97 -1.87 -2.42 43.48 11.29 0.37 -0.05 0 1936
1937 43.0 3.61 1.01 -1.88 45.68 5.06 4.85 0.21 0 1937
1938 42.2 -1.86 1.69 -1.93 45.51 -0.37 7.15 -0.20 0 1938
1939 41.6 -1.42 0.74 -2.07 49.27 8.26 7.47 0.56 0 1939
1940 42.0 0.96 0.43 -1.73 55.20 12.04 7.16 1.90 0 1940
1941 44.1 5.00 1.22 -0.33 62.51 13.24 7.53 3.89 1 1941
1942 48.8 10.66 2.56 1.78 71.16 13.84 9.27 7.04 1 1942
1943 51.8 6.15 4.18 2.93 89.91 26.35 14.59 10.81 1 1943
1944 52.7 1.74 4.84 2.77 106.82 18.81 16.74 12.01 1 1944
1945 53.9 2.28 5.12 2.75 126.63 18.55 18.06 12.48 1 1945
1946 58.5 8.53 5.81 3.49 138.73 9.56 17.29 12.30 0 1946
1947 66.9 14.36 6.51 4.52 146.00 5.24 15.46 12.32 0 1947
1948 72.1 7.77 6.84 5.50 148.11 1.45 10.50 12.52 0 1948
1949 71.4 -0.97 6.26 5.55 147.46 -0.44 6.66 11.59 0 1949
1950 72.1 0.98 5.99 5.55 150.81 2.27 3.56 10.57 0 1950
1951 77.8 7.91 5.87 5.84 156.45 3.74 2.43 9.61 0 1951
1952 79.5 2.19 3.51 5.00 164.92 5.41 2.47 8.77 0 1952
1953 80.1 0.75 2.13 4.46 171.19 3.80 2.94 6.65 0 1953
1954 80.5 0.50 2.43 4.33 177.16 3.49 3.74 5.19 0 1954
1955 80.2 -0.37 2.15 4.05 183.69 3.69 4.02 3.79 0 1955
1956 81.4 1.50 0.91 3.36 186.87 1.73 3.62 3.02 0 1956
1957 84.3 3.56 1.18 2.34 191.82 2.65 3.07 2.77 0 1957
1958 86.6 2.73 1.57 1.85 201.12 4.85 3.28 3.11 0 1958
1959 87.3 0.81 1.64 2.03 210.09 4.46 297.8 3.47 3.60 0 1959
1960 88.7 1.60 2.04 2.09 210.67 0.28 312.4 4.90 2.78 3.40 0 1960
1961 89.6 1.01 1.94 1.42 221.24 5.02 335.5 7.39 3.43 3.53 0 1961
1962 90.6 1.12 1.45 1.32 233.92 5.73 362.7 8.11 4.05 3.56 0 1962
1963 91.7 1.21 1.15 1.36 249.15 6.51 393.2 8.41 4.38 3.82 0 1963
1964 92.9 1.31 1.25 1.44 264.73 6.25 424.7 8.01 7.36 4.10 0 1964
1965 94.5 1.72 1.27 1.65 285.89 7.99 459.2 8.12 8.01 4.52 1 1965
1966 97.2 2.86 1.64 1.79 308.02 7.74 480.2 4.57 7.44 5.12 1 1966
1967 100.0 2.88 1.99 1.72 331.78 7.71 524.8 9.29 7.67 5.63 1 1967
1968 104.2 4.20 2.59 1.87 361.60 8.99 566.8 8.00 7.59 6.04 1 1968
1969 109.8 5.37 3.40 2.32 385.17 6.52 587.9 3.72 6.72 7.04 1 1969
1970 116.3 5.92 4.24 2.75 401.29 4.19 626.5 6.57 6.41 7.21 1 1970
1971 121.3 4.30 4.53 3.08 710.3 13.38 8.14 7.79 1 1971
1972 125.3 3.30 4.61 3.30 802.3 12.95 8.86 8.26 1 1972
1973 133.1 6.23 5.02 3.80 855.5 6.63 8.58 8.08 1 1973
1974 147.7 10.97 6.11 4.75 902.1 5.45 8.94 7.82 1 1974
1975 161.2 9.14 6.75 5.49 1016.2 12.65 10.16 8.27 1 1975
1976 170.5 5.77 7.05 5.78 1152.0 13.36 10.15 9.14 0 1976
1977 181.5 6.45 7.69 6.14 1270.3 10.27 9.63 9.24 0 1977
1978 195.4 7.66 7.98 6.49 1366.0 7.53 9.81 9.19 0 1978
1979 217.4 11.26 8.04 7.07 1473.7 7.88 10.31 9.63 0 1979
1980 246.8 13.52 8.89 7.81 1599.8 8.56 9.50 9.83 0 1980
1981 272.4 10.37 9.82 8.43 1755.5 9.73 8.79 9.47 0 1981
1982 289.1 6.13 9.76 8.72 1909.3 8.76 8.49 9.06 0 1982
1983 298.4 3.22 8.84 8.41 2125.7 11.33 9.25 9.53 0 1983
1984 311.1 4.26 7.43 7.73 2308.8 8.61 9.39 9.85 0 1984
1985 322.2 3.57 5.48 7.17 2494.6 8.05 9.29 9.40 0 1985
1986 328.4 1.92 3.81 6.77 2731.4 9.49 9.24 9.02 0 1986
1987 340.4 3.65 3.32 6.49 2830.8 3.64 8.19 8.34 0 1987
1988 354.3 4.08 3.49 6.13 2993.9 5.76 7.09 8.16 0 1988
1989 371.3 4.80 3.60 5.50 3158.4 5.49 6.47 7.92 0 1989
1990 391.4 5.41 3.97 4.72 3276.8 3.75 5.61 7.43 0 1990
1991 408.0 4.24 4.44 4.12 3377.0 3.06 4.33 6.76 0 1991
1992 420.3 3.01 4.31 3.81 3430.3 1.58 3.92 6.03 0 1992
1993 432.7 2.95 4.08 3.79 3480.9 1.48 3.06 5.06 0 1993
1994 444.0 2.61 3.64 3.62 3496.7 0.45 2.06 4.24 0 1994
1995 456.5 2.82 3.13 3.55 3640.7 4.12 2.13 3.85 0 1995
1996 469.9 2.94 2.87 3.65 3820.1 4.93 2.50 3.41 0 1996
1997 480.8 2.32 2.73 3.51 4033.4 5.58 3.29 3.60 0 1997
1998 488.3 1.56 2.45 3.26 4377.4 8.53 4.69 3.87 0 1998
1999 499.0 2.19 2.36 3.00 4635.0 5.88 5.80 3.91 0 1999
2000 515.8 3.37 2.47 2.80 4917.2 6.09 6.20 4.14 0 2000
2001 530.4 2.83 2.45 2.66 5431.2 10.45 7.29 4.87 0 2001
2002 538.8 1.58 2.30 2.51 5784.7 6.51 7.48 5.36 0 2002
2003 551.1 2.28 2.45 2.45 6071.7 4.96 6.76 5.72 0 2003
2004 565.8 2.67 2.54 2.45 6412.2 5.61 6.71 6.25 0 2004
2005 585.0 3.39 2.55 2.51 6674.1 4.08 6.30 6.25 0 2005
2006 603.9 3.23 2.63 2.54 7033.6 5.39 5.31 6.29 0 2006
2007 621.1 2.85 2.88 2.59 7438.4 5.76 5.16 6.31 0 2007
2008 645.0 3.84 3.20 2.82 8153.7 9.62 6.07 6.42 0 2008
---- ------- ------- ------- ------- ------- ------- ------- ------- ------- ------- --- ----
Note: composition of M2 from 1867 to 1970 differs from that of M2SL from 1959 to 2008;
M2SL was used to calculate the 5-year and 10-year annualized percents from 1964 and
1969, respectively; World War I spans from U.S. entry in 1917 to end of war in 1918;
Vietnam War spans from 1965 when U.S. forces increased from 23,300 to 184,300 to end
of war in 1975
Source: CPI, 1913 to 2008: Bureau of Labor Statistics, Series CUUR0000AA0;
M2, 1959 to 2008: Federal Reserve, Series M2SL;
older data: Historical Statistics of the United States, Colonial Times to 1970,
Series E 135 and X 415;
CPI, 1800 to 1998 figures also at this link