Click here to go to the app that generates the following graphs
Click here to see a comparison of data from the U.S. Budget for Fiscal Years 2023 and 2022
Click here to see a comparison of data from the U.S. Budget for Fiscal Years 2022 and 2021
Click here to see a comparison of data from the U.S. Budget for Fiscal Years 2021 and 2020
Click here to see a comparison of data from the U.S. Budget for Fiscal Years 2020 and 2019
Click here to see a comparison of data from the U.S. Budget for Fiscal Years 2019 and 2018
Comparison of data from the U.S. Budget for Fiscal Years 2024 and 2023
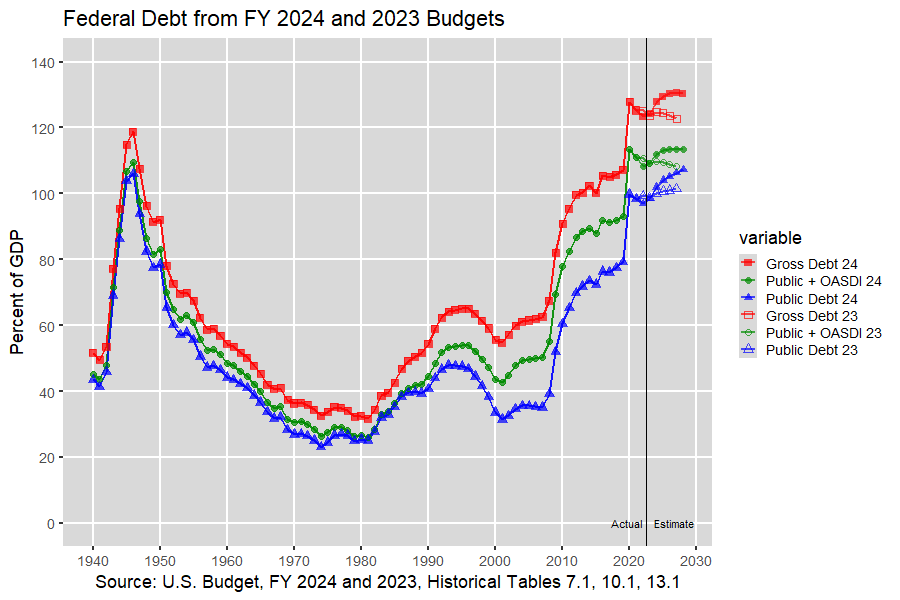
Federal Debt: Interactive Graph
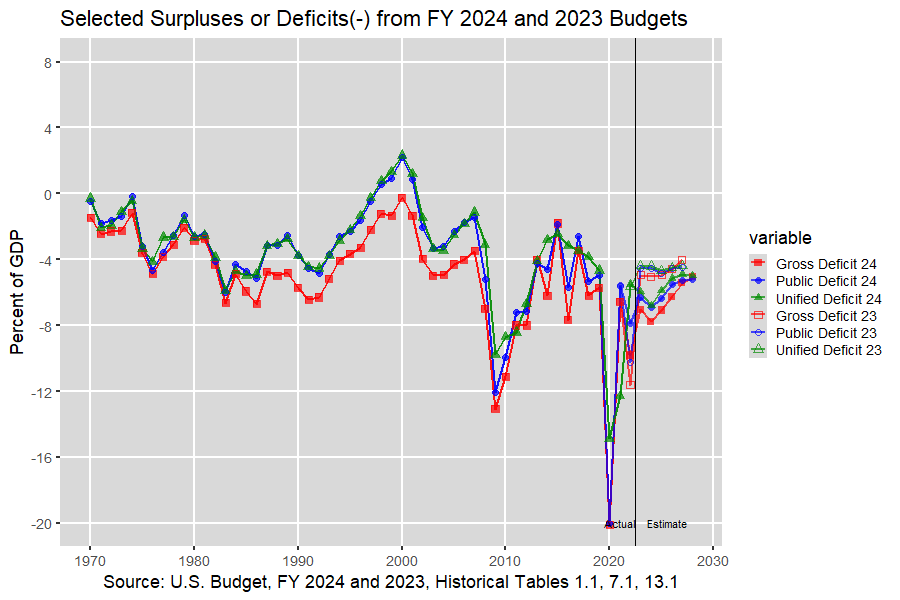
Selected Surpluses or Deficits(-): Interactive Graph
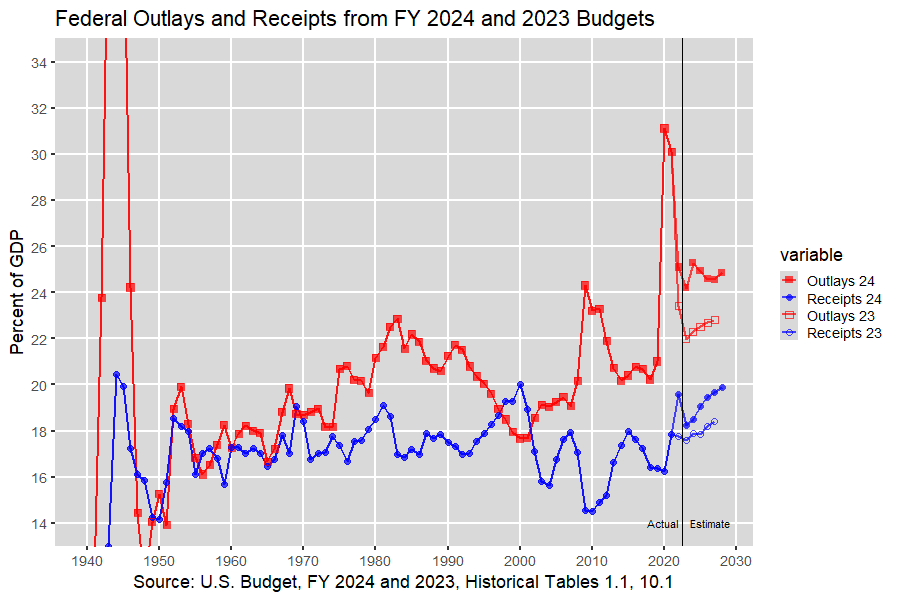
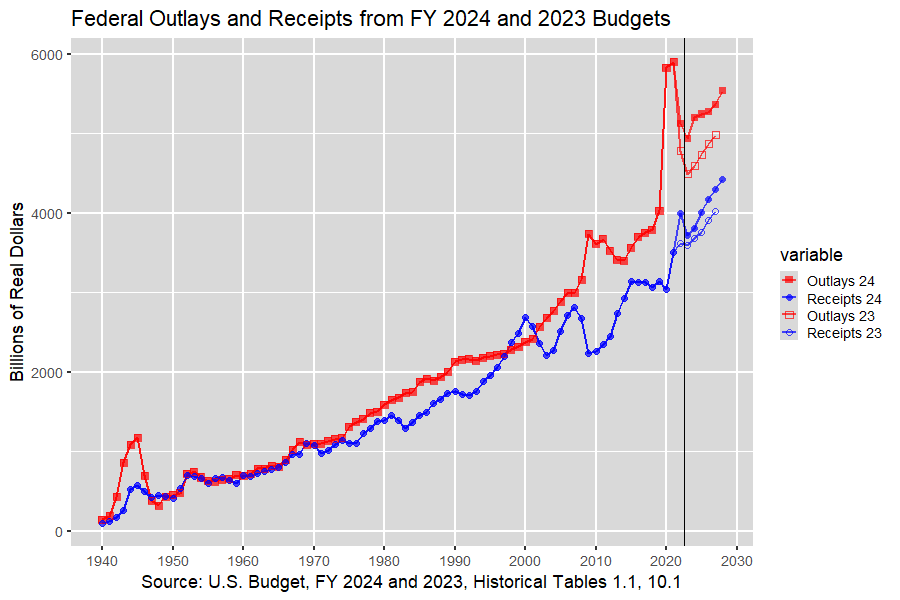
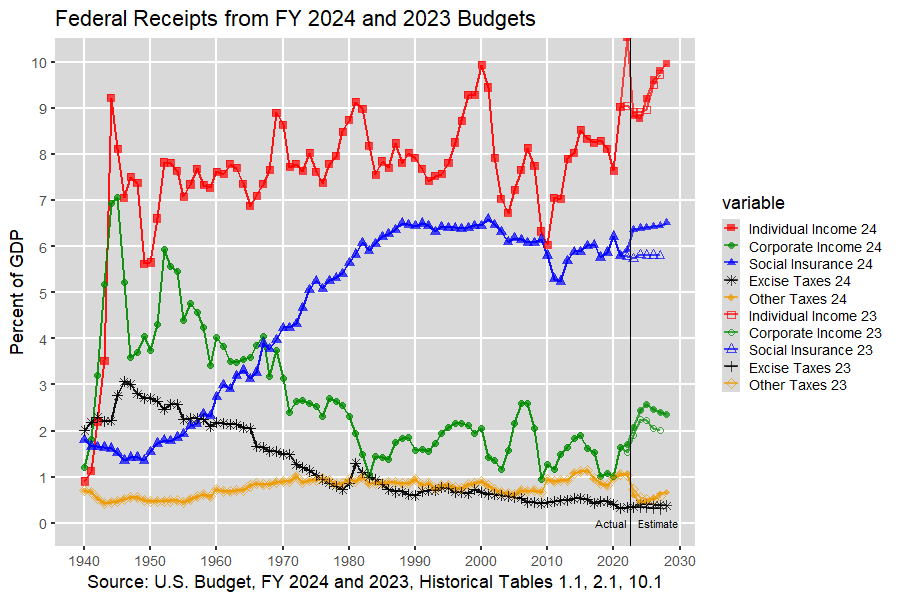
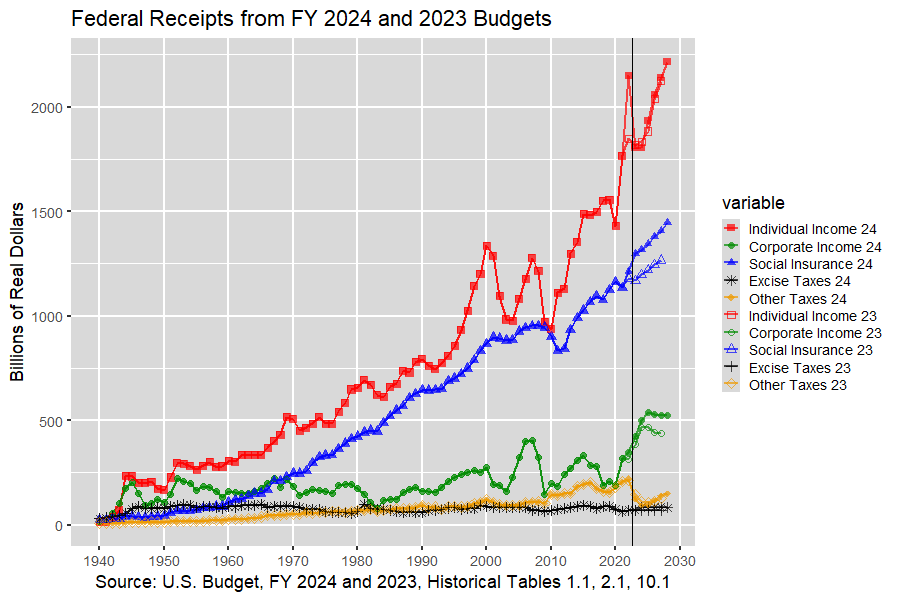
Federal Receipts:
Interactive Graphs:
Outlays and Receipts as Percent of GDP ,
Outlays and Receipts in Real Dollars ,
Receipts by Source as Percent of GDP ,
and Receipts by Source in Real Dollars
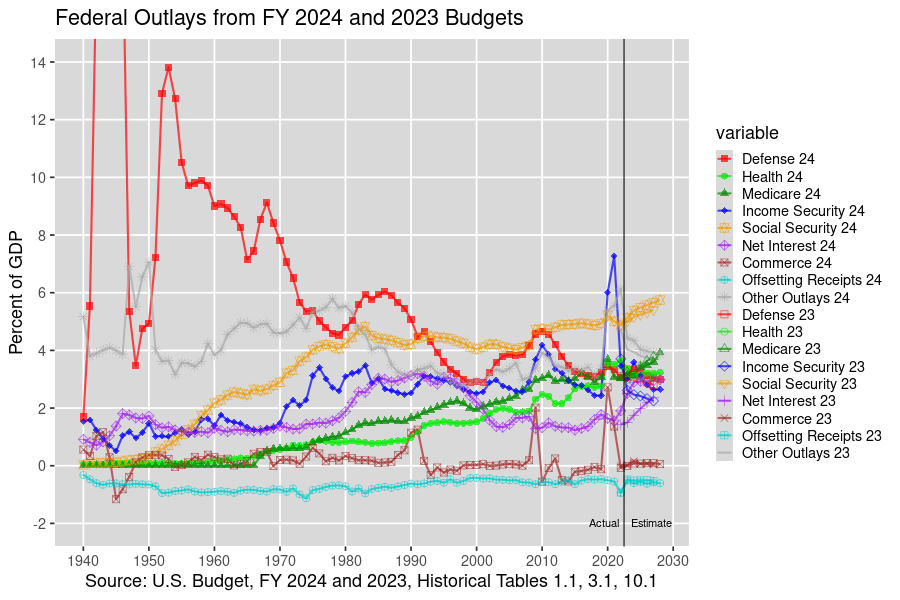
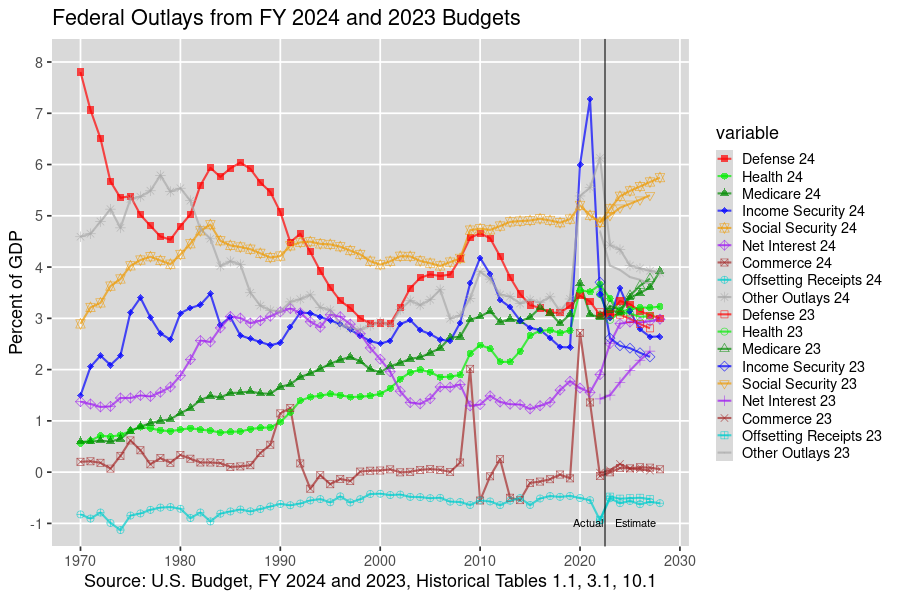
Federal Outlays:
Interactive Graphs:
Top Outlays, 1940-2028,
Top Outlays, 1970-2028,
Next Outlays, 1940-2028,
Next Outlays, 1970-2028,
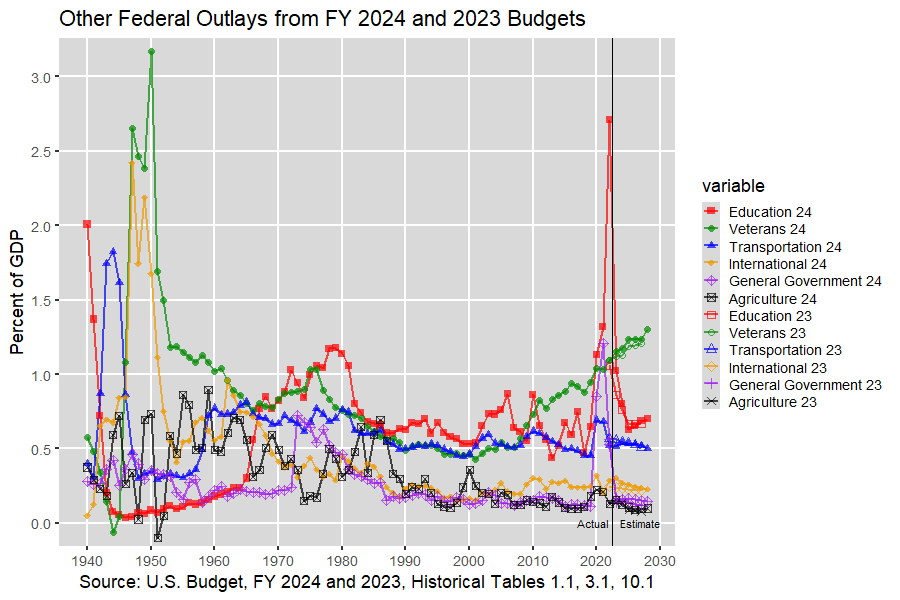
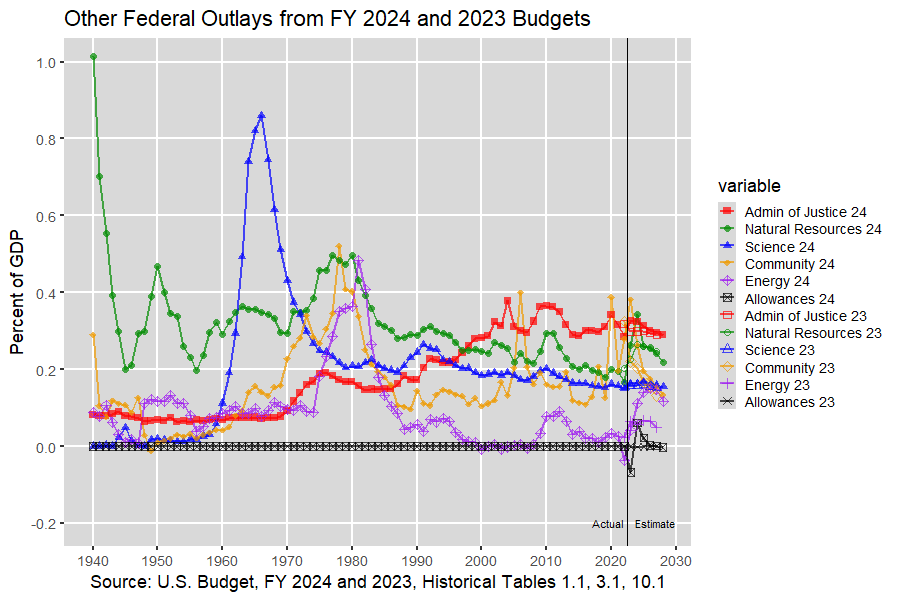
Other Outlays, 1940-2028,
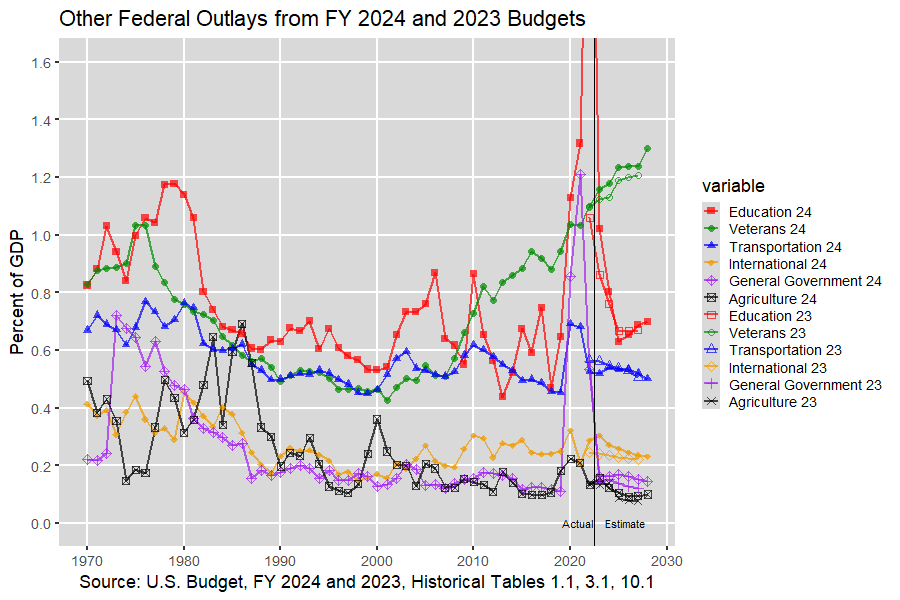
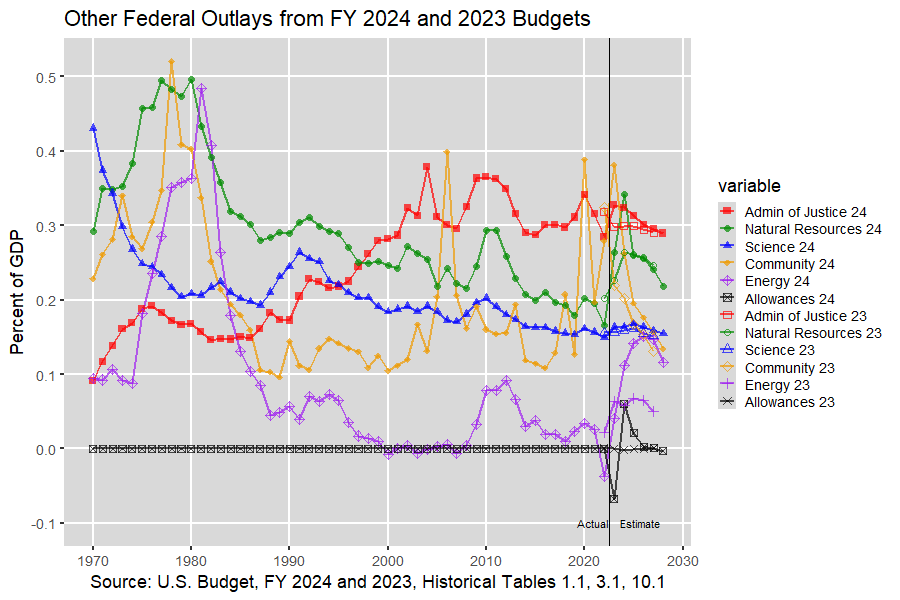
and Other Outlays, 1970-2028
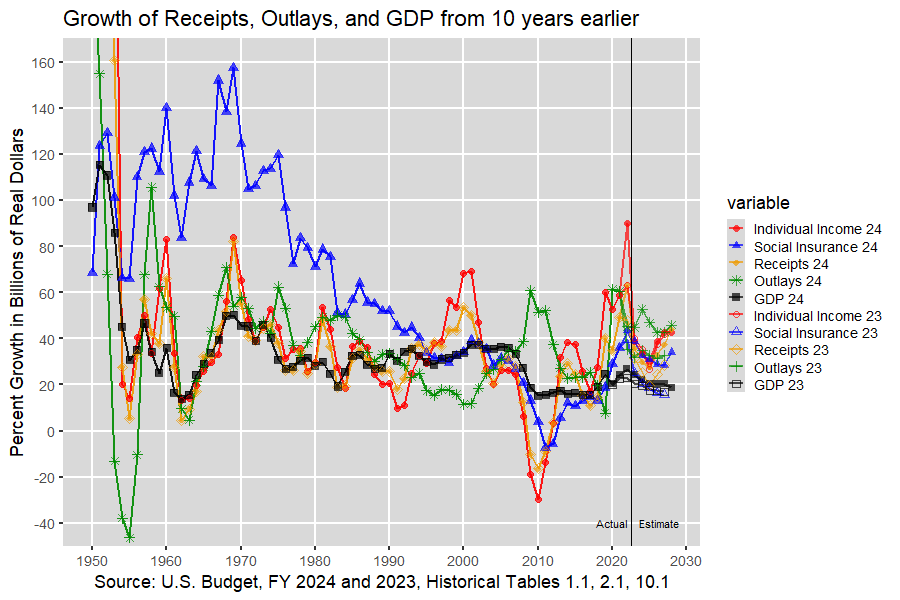
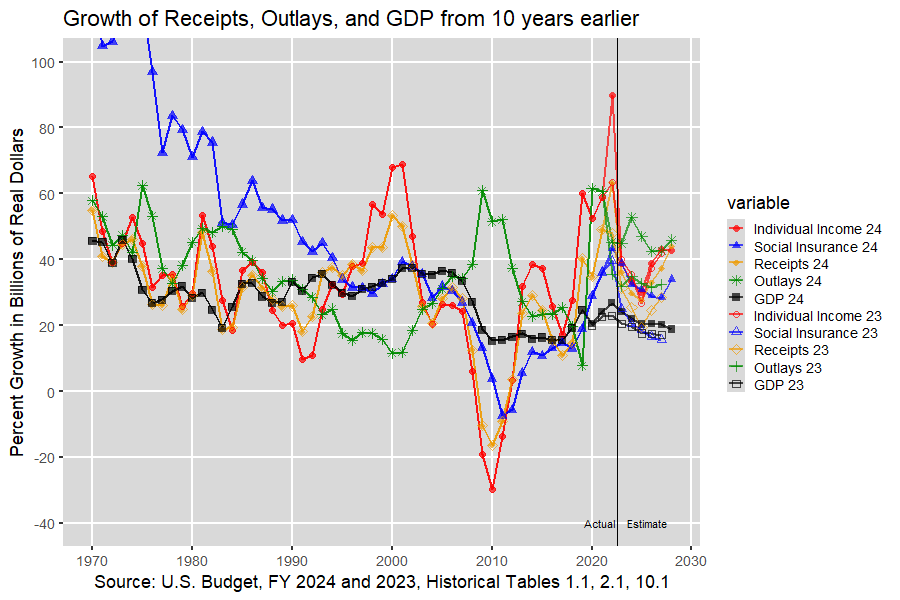
Growth from 10 Years Earlier: Interactive Graph
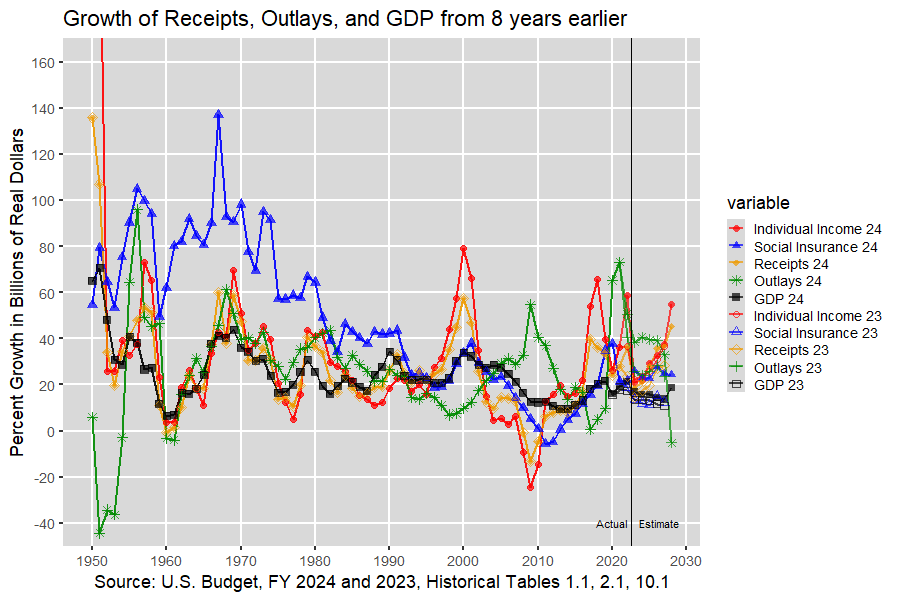
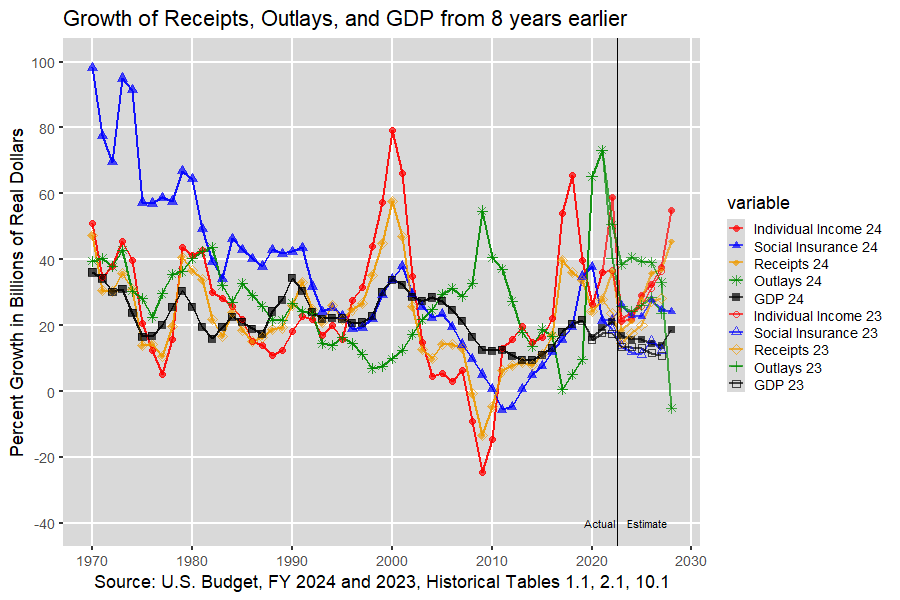
Growth from 8 Years Earlier: Interactive Graph
Sources:
Budget of the United States Government, FY 2023: Historical Tables, tables 1.1, 2.1, 3.1, 7.1, 10.1, and 13.1;
Budget of the United States Government, FY 2022: Historical Tables, tables 1.1, 2.1, 3.1, 7.1, 10.1, and 13.1
Comparison of data from the U.S. Budget for Fiscal Years 2022 and 2021
Comparison of data from the U.S. Budget for Fiscal Years 2021 and 2020
Comparison of data from the U.S. Budget for Fiscal Years 2020 and 2019
Comparison of data from the U.S. Budget for Fiscal Years 2019 and 2018
Comparison of data from the U.S. Budget for Fiscal Years 2018 and 2017
Graphs based on data from the prior budget for FY 2017
Go to Budget Home Page