| Pair | Topic |
Observation |
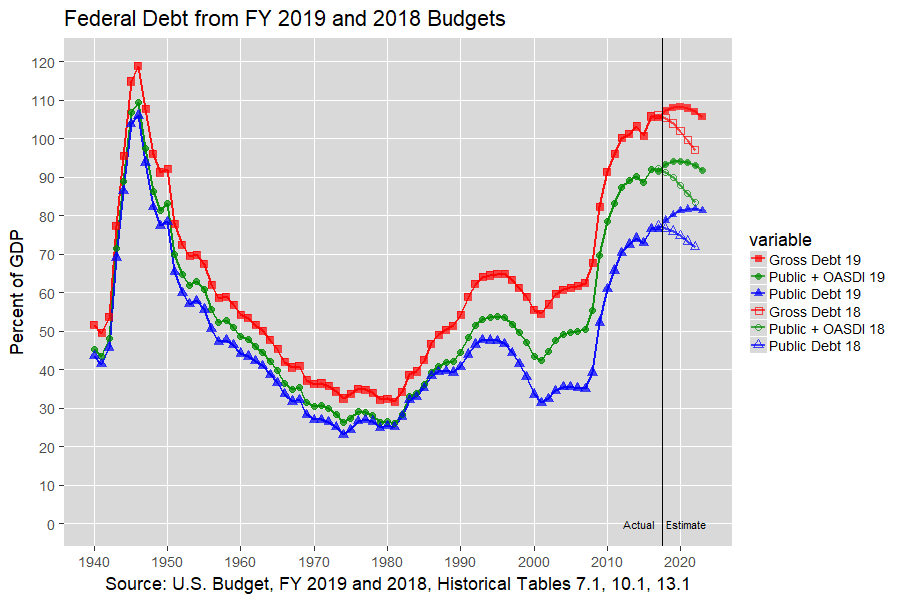
| 1 | Debt |
Trump's prior budget projected that the debt held by the public would drop by about 5 percent of GDP from 2017 to 2022. This budget projects that it will increase by about 5 percent of GDP. Similarly, this budget revises the projected change in the gross debt from a 9 percent of GDP decrease to a nearly 2 percent increase over that period. |
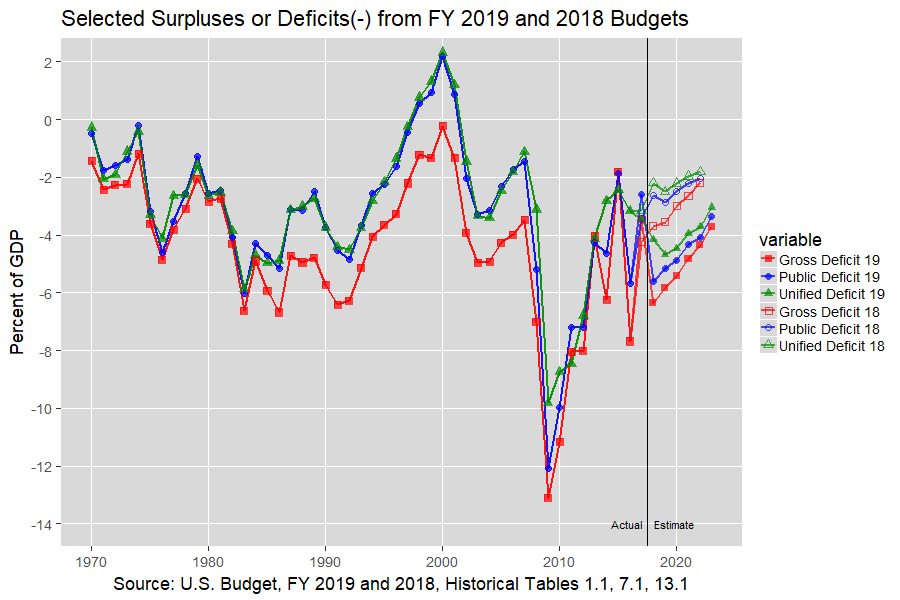
| 2 | Deficit |
The prior budget projected that the unified deficit would drop from 3.1 percent of GDP in 2017 to 1.8 percent of GDP in 2022. This budget projects that it will vary between 3.5 and 4.7 percent of GDP during that period. |
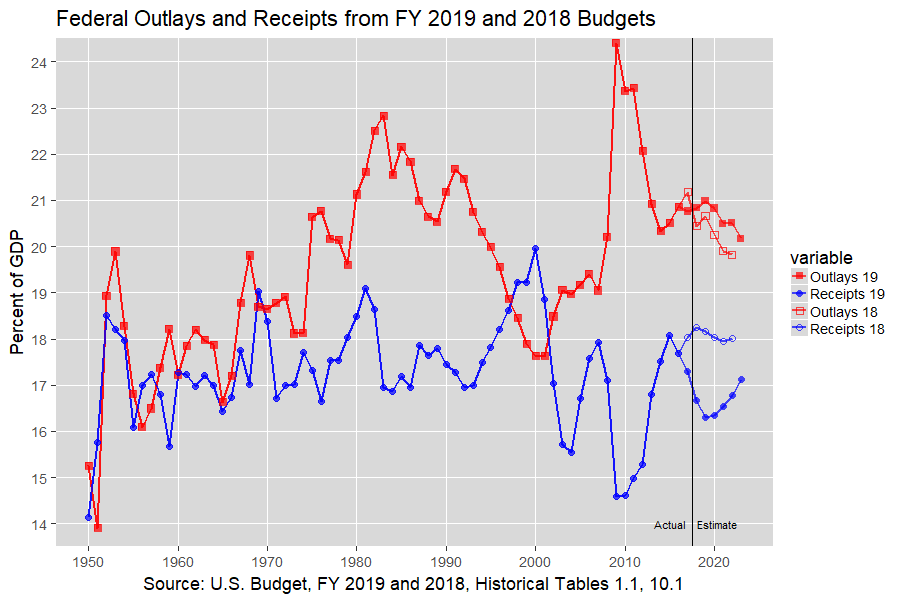
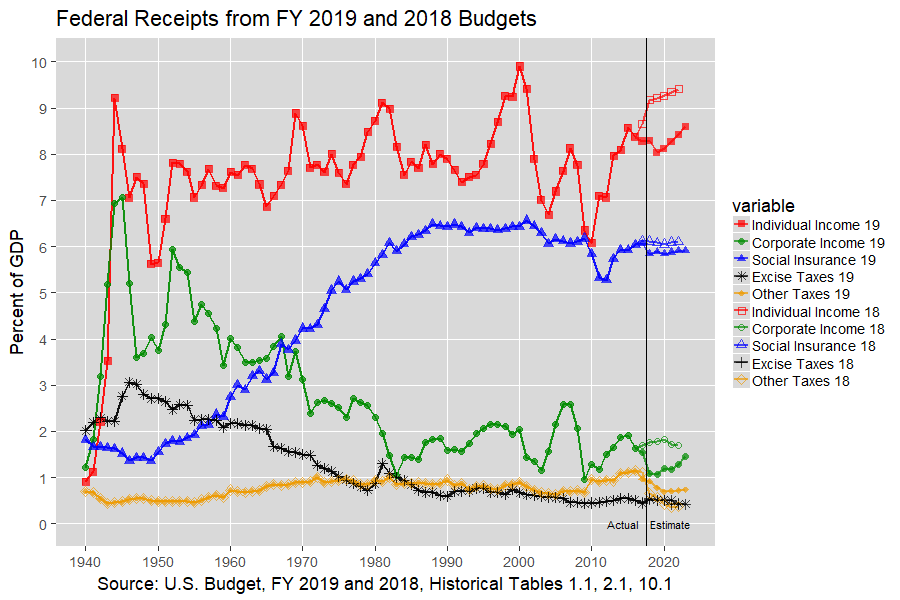
| 3 | Receipts |
The prior budget projected that receipts would stabilize at about 18 percent of GDP whereas this budget projects that receipts will drop from 17.3 percent of GDP in 2017 to 16.3 percent in 2019 and recover to 16.8 percent of GDP by 2022. As both budgets make similar projections for outlays, receipts appear to be the main driver for the change in projections for the debt and deficit. |
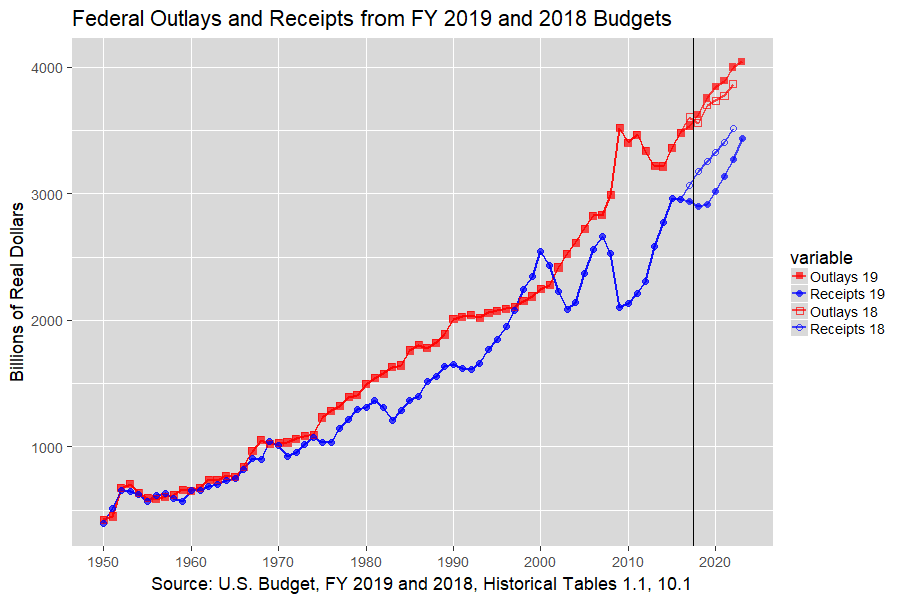
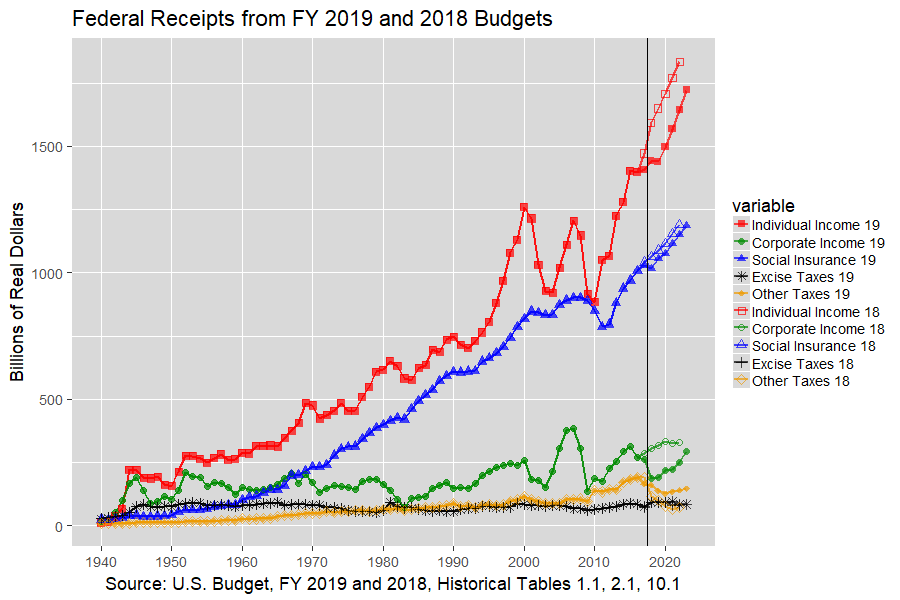
| 4 | Receipts |
The prior budget projected steady growth in real receipts from 2017 to 2022 whereas this budget projects that real receipts will stagnate through 2019 before resuming growth. |
| 5‑6 | Receipts |
The prior budget projected that individual tax receipts would grow from 8.7 to 9.5 percent of GDP from 2017 to 2022. This budget projects that they will vary from 8.0 to 8.4 percent of GDP during that period. Similarly, the prior budget projected that corporate tax receipts would be 1.7 to 1.8 percent of GDP during that period but this budget projects that they will drop from 1.5 percent of GDP in 2017 to 1.1 percent of GDP and recover to 1.3 percent of GDP by 2022. This decline in individual and corporate tax receipts is likely due to the Tax Cuts and Jobs Act of 2017. |
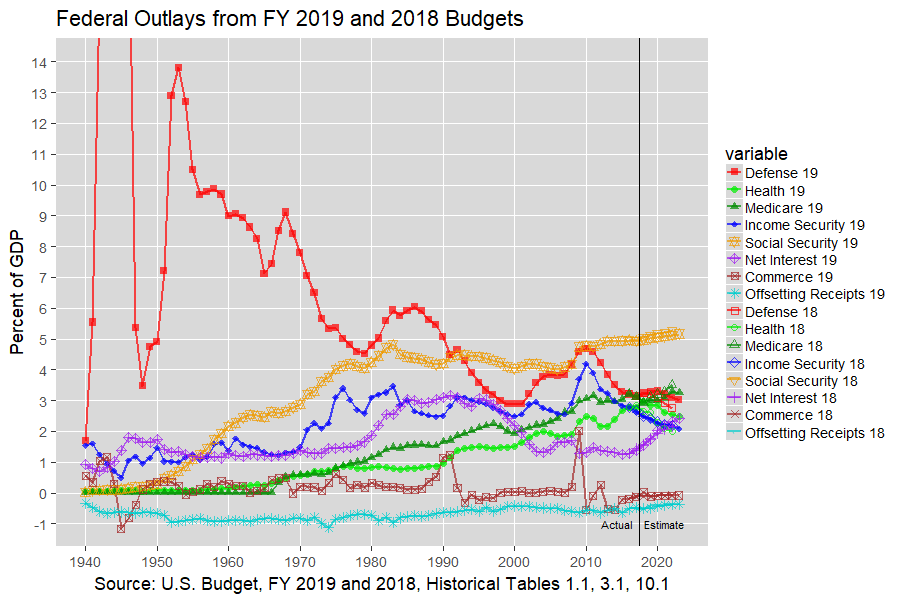
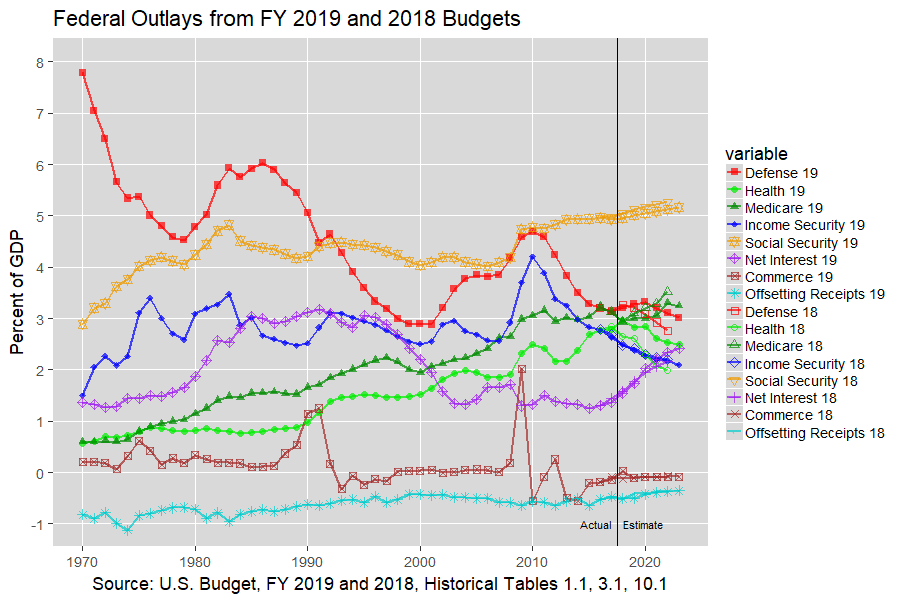
| 7‑8 | Outlays |
In the prior budget, outlays for Medicare were projected to continue rising and outlays for Defense were projected to continue falling through 2022 (as a percent of GDP). In this budget, they both pretty much stabilize at 3 percent of GDP through 2022. In this budget, it appears that projected spending on Health (which is chiefly Medicaid) and Net Interest rise slightly from the prior budget. |
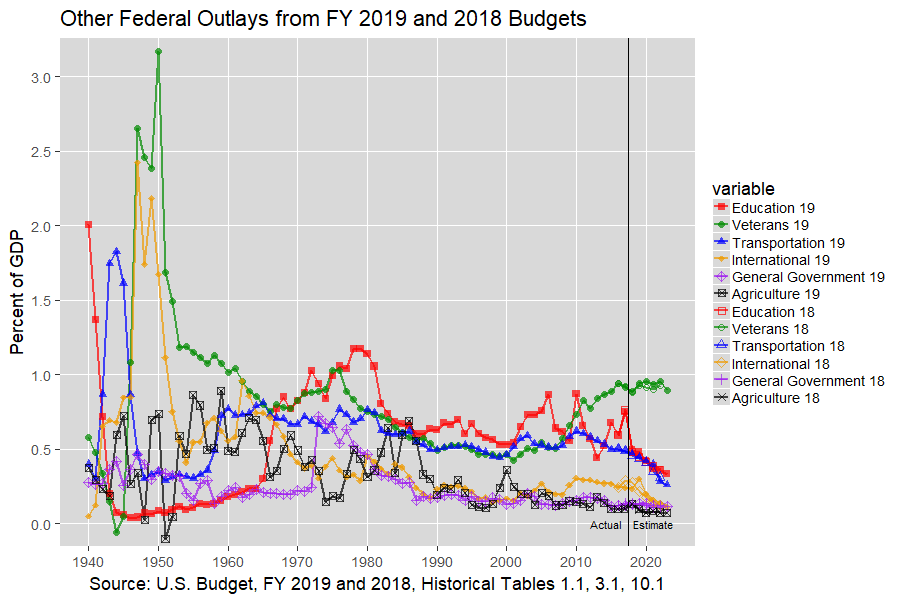
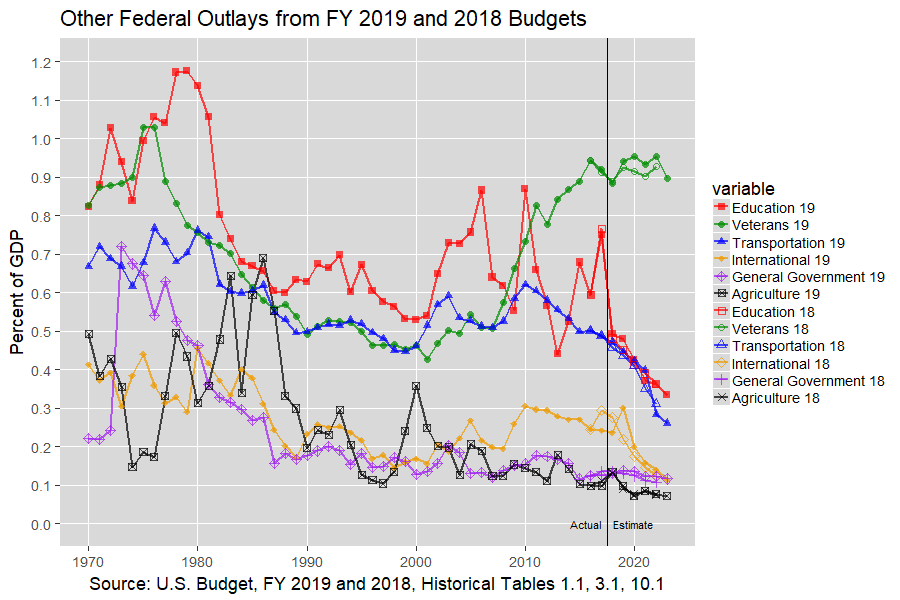
| 9‑10 | Outlays |
In this budget, there is little discernible change in the projected outlays for Education, Transportation, International, General Government, and Agriculture spending from the prior budget. |
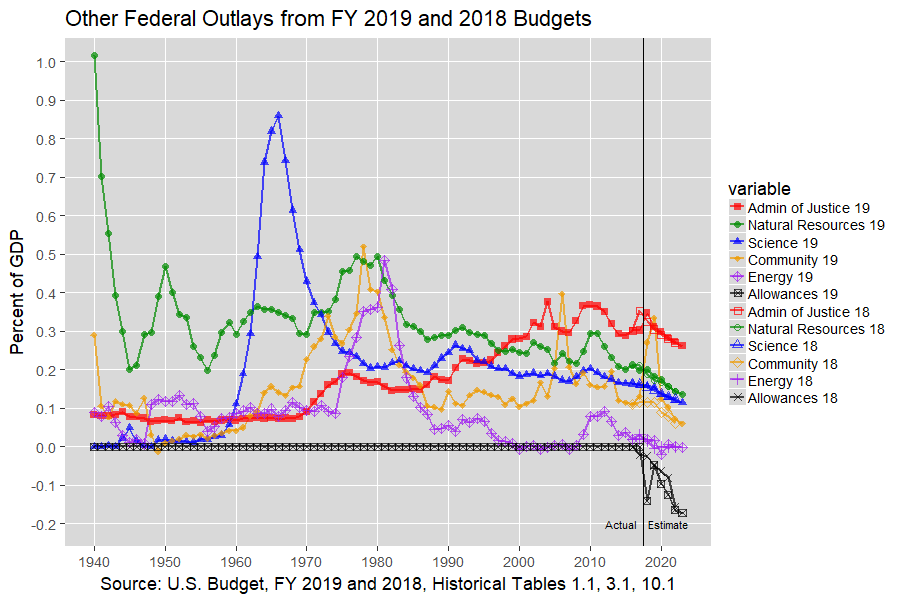
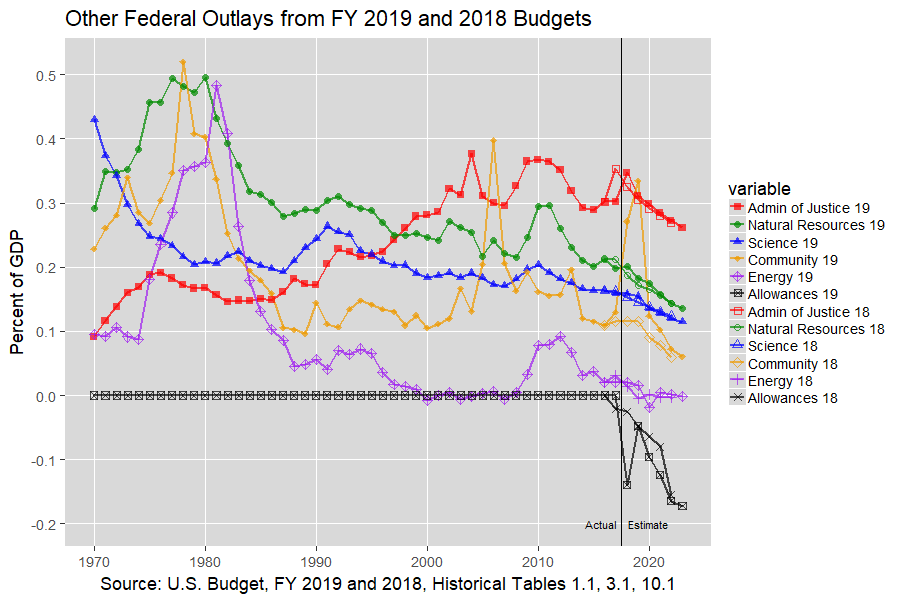
| 11‑12 | Outlays |
In this budget, the one discernible change in projected outlays for Administration of Justice, Natural Resources, Science, Energy, Allowances, and Community and Regional Development is the last function. Historical Table 3.2 shows that it increases from about $25 billion in 2017 to $54 billion in 2018 and $70 billion in 2019 before returning to $27 billion in 2020. The increase in 2018 is chiefly in the subfunction of "Disaster relief and insurance" and the increase in 2019 is chiefly in the subfunction of "Area and regional development". Much of this last amount might be for infrastructure but it's not clear from that table. |
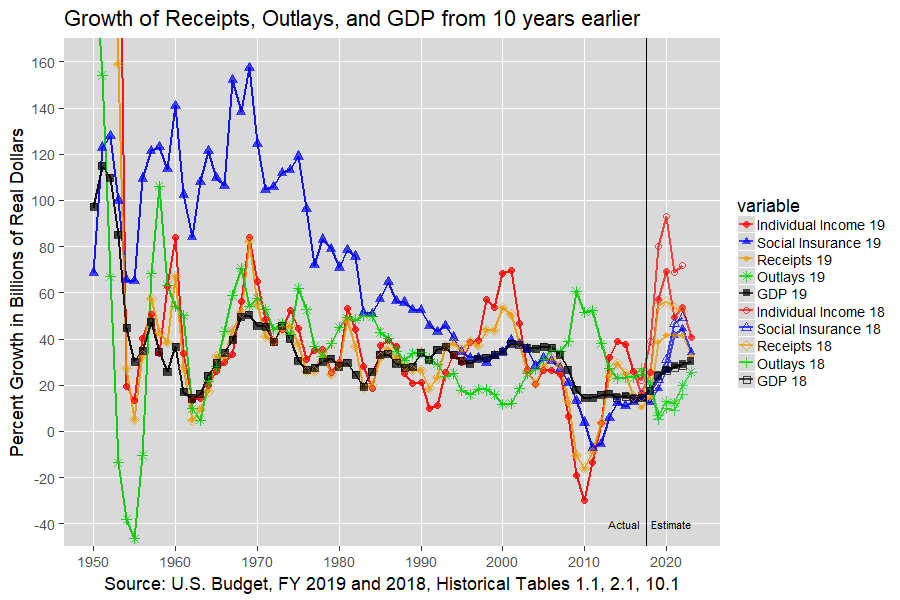
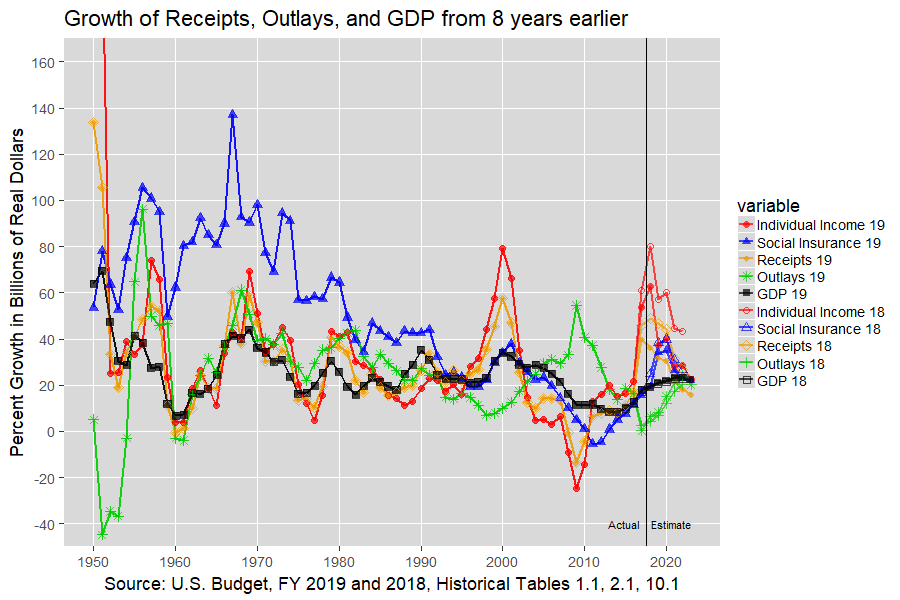
| 13‑14 | Growth |
In the prior budget, individual income tax receipts were projected to grow about 70 percent in the 10 years ending in 2022 and about 40 percent in the 8 years ending in 2022. In this budget, those growth rates drop to 53.8 and 28.4 percent, respectively. This drop in individual and corporate tax receipts is likely due to the Tax Cuts and Jobs Act of 2017. |